|
|
|

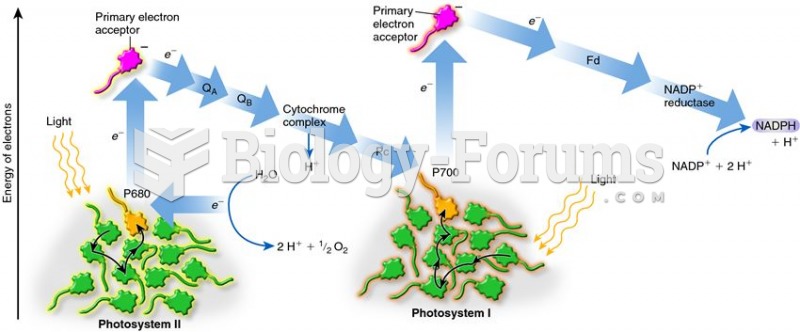 The Z scheme, which depicts the energy of an electron as it moves from photosystem II to NADP+
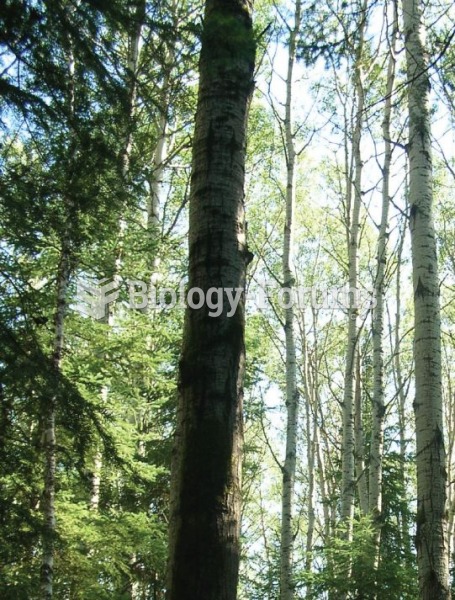 Changes in boreal forest composition along a chronosequence in Quebec. Dates refer to the year of th
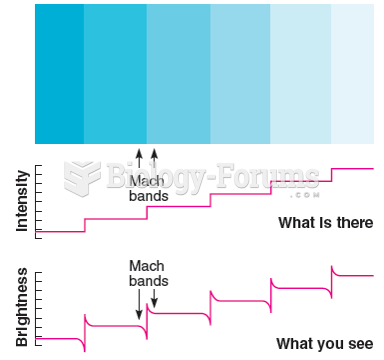 The illusory bands visible in this figure are often called Mach bands, although Mach used a ...
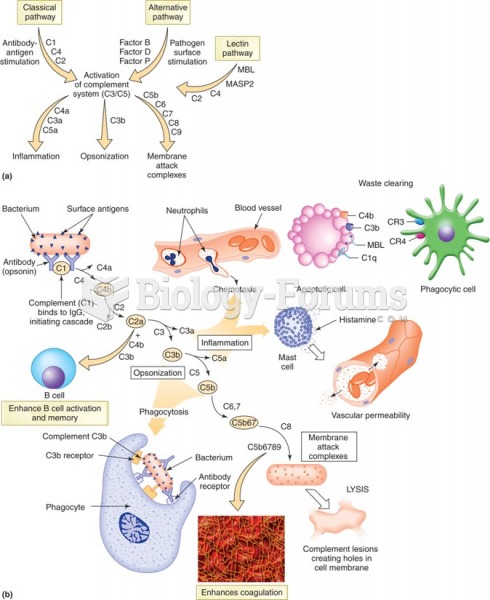 Three pathways of complement combined. (a) Figure shows a summary of how each pathway proceeds. (b) ...
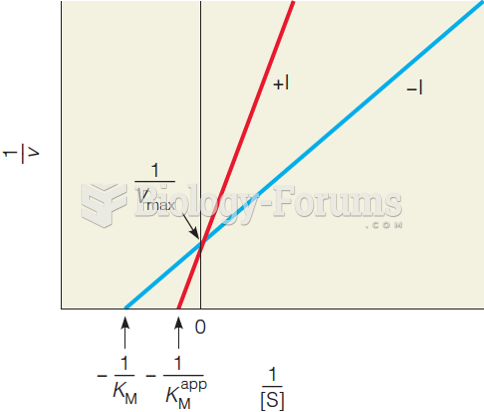 Lineweaver–Burk plots of the reactions with and without a competitive inhibitor
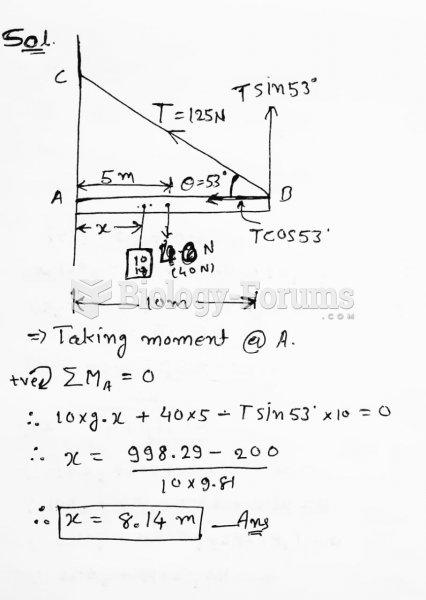 In the figure, a 10.0-m long bar is attached by a frictionless hinge to a wall and held ...