If you were looking at a scatter plot generated by SPSS that had small numbers instead of dots, your should assume that the numbers represent _____.
a. footnotes that indicate who the subjects were who generated each data point
b. the level of significance for each pair of measurements
c. the number of cases with the same measurements
d. footnotes that explain the various measurement procedures
Question 2
It is legitimate to do ratios with interval scaling.
Indicate whether the statement is true or false

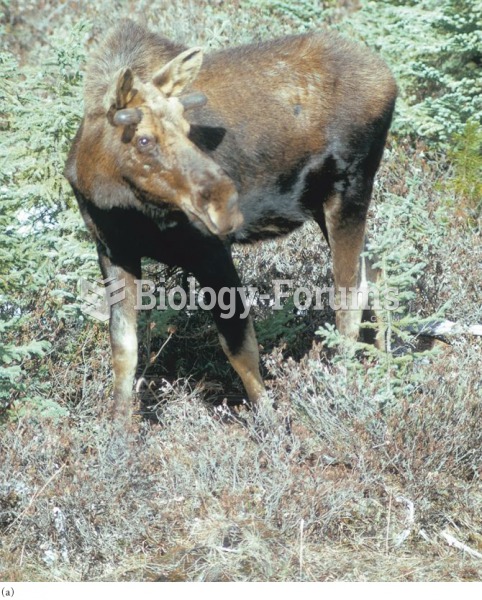 (a) With few ticks, moose retain a brown coat; (b) at high numbers of ticks, moose self-groom, destr
 Small Copper
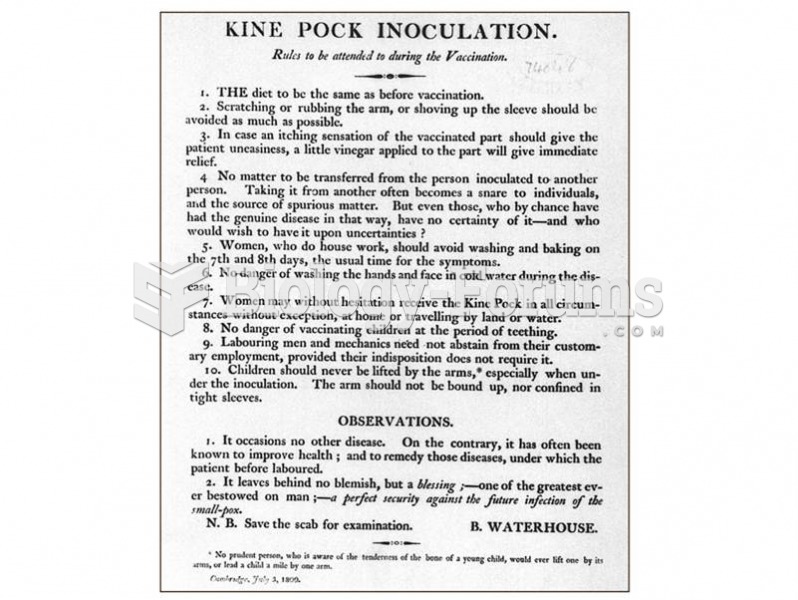 Early instructions for administration of the small pox vaccine.
 Human-Generated Aerosols
 Gene-expression analysis generated from expression DNA microarrays
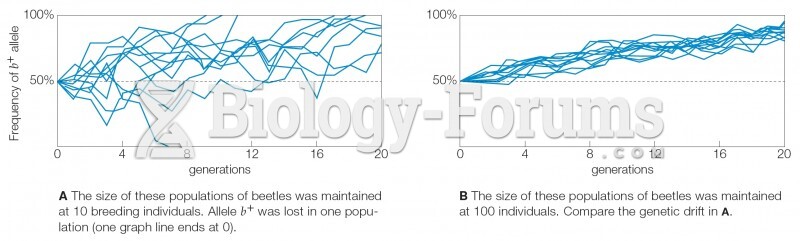 Genetic Drift in Large and Small Populations