Refer to Figure 4-2. What area represents the decrease in producer surplus when the market price falls from P2 to P1?
A) B + D B) A + B C) C + E D) A + C + E
Question 2
Refer to Figure 5-1. Suppose the current market equilibrium output of Q1 is not the economically efficient output because of an externality. The economically efficient output is Q2. In that case, the diagram shows
A) the effect of an external cost imposed on a producer.
B) the effect of a positive externality in the production of a good.
C) the effect of a negative externality in the production of a good.
D) the effect of an external benefit such as a subsidy granted to consumers of a good.

 The actions of Frzb and the Frizzled receptor protein show how embryonic development represents a ba
 Changes in boreal forest composition along a chronosequence in Quebec. Dates refer to the year of th
 Broca’s Area
 Ugonachomma display figure, Igbo, Nigeria.
 Two areas of reduced cortical volume and one area of increased cortical volume observed in people ...
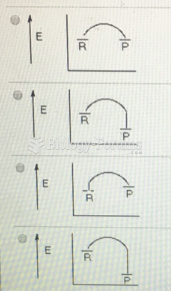 Which of the following represents a reaction coordinate diagram for a chemical reaction whose ...