When interpreting a graph that shows the means of two groups connected by a straight line, what feature of the graph indicates a relatively large difference between the groups?
a. the height of the higher end point c. the height of the center of the line
b. the slope of the line d. the length of the line
Question 2
On a graph showing the result of a between subjects factorial study, one independent variable is graphed along the X-axis, and the other is shown _____.
a. on the Y-axis c. via the lines on the graph
b. on a Z-axis d. on a separate graph

 Mechanical ventilation. The photograph shows a patient receiving breathing assistance by the use of
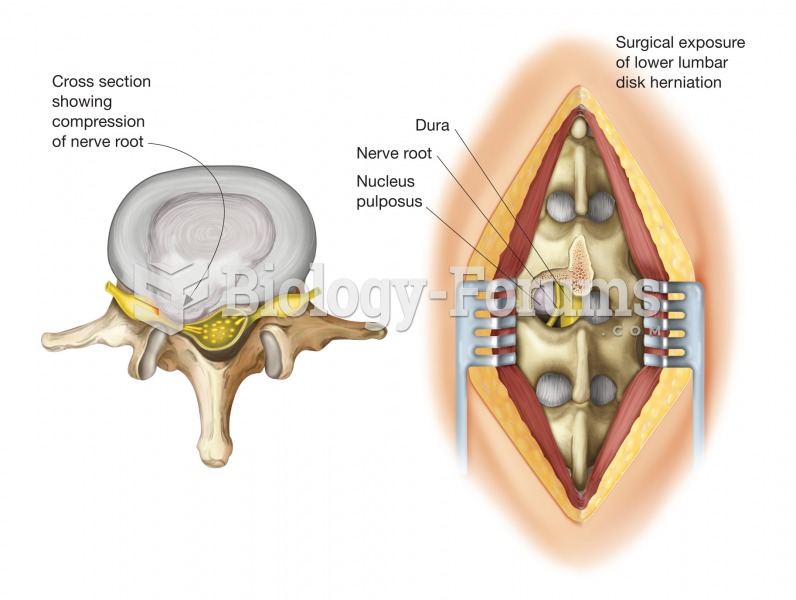 Herniated disk. A herniated disk is a protrusion of the disk’s gelatinous center, called the nucleus
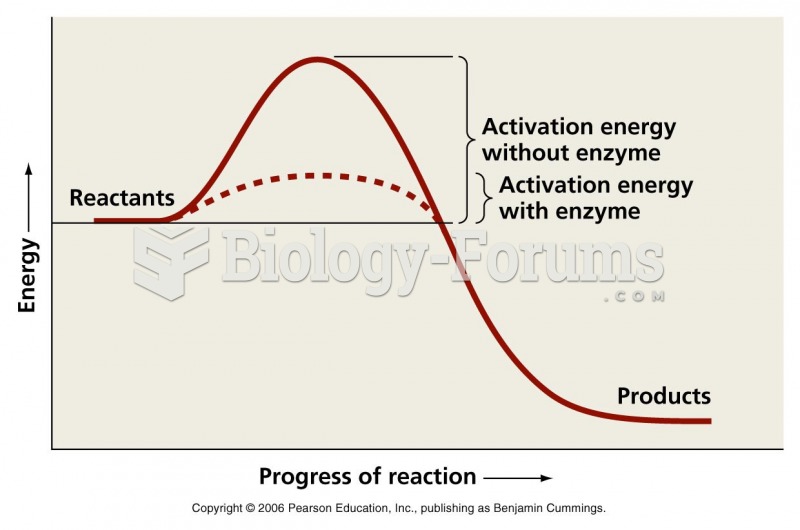 Activation energy graph
 graph
graph
 graph
graph
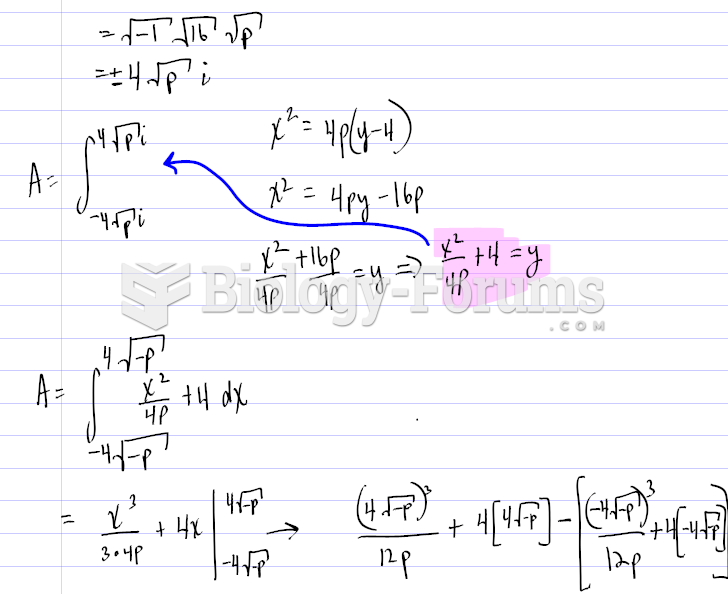 Finding the graph of a Parabola using certain values