When interpreting a graph that shows the means of two groups connected by a straight line, what feature of the graph indicates a relatively large difference between the groups?
a. the height of the higher end point c. the height of the center of the line
b. the slope of the line d. the length of the line
Question 2
On a graph showing the result of a between subjects factorial study, one independent variable is graphed along the X-axis, and the other is shown _____.
a. on the Y-axis c. via the lines on the graph
b. on a Z-axis d. on a separate graph

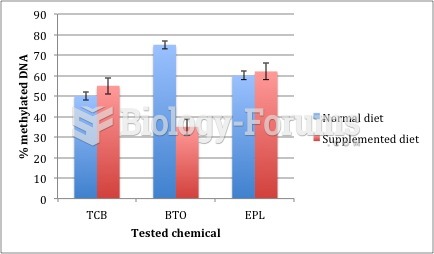 Graph of 3 compounds tested
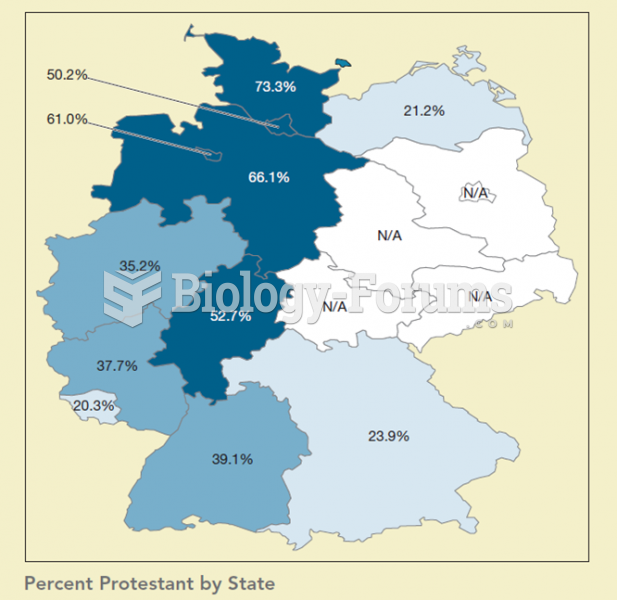 This map shows the percentage of Protestants by state in Germany. When compared to the previous map
 Line analysis of Titian, Assumption and Consecration of the Virgin.
 A typical two-line cleaning machine hookup, showing an extension hose that can be used to squirt a ...
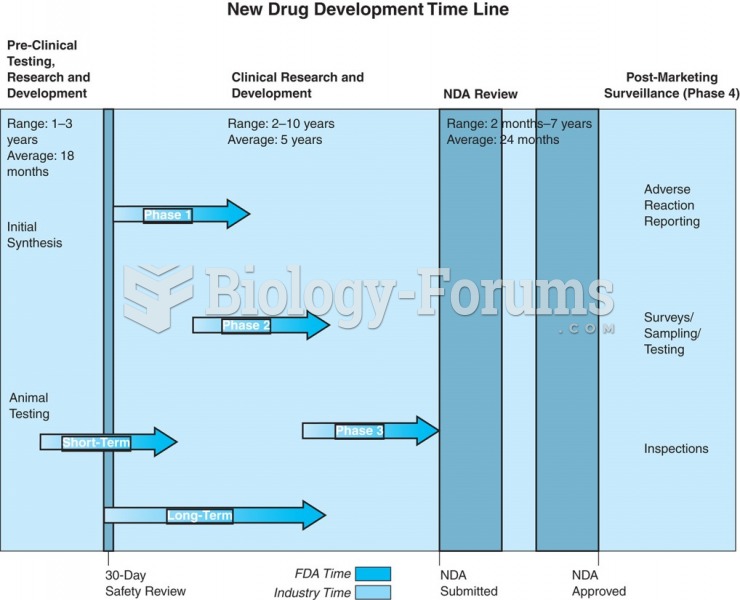 A new drug development time line with the four phases of drug approval.
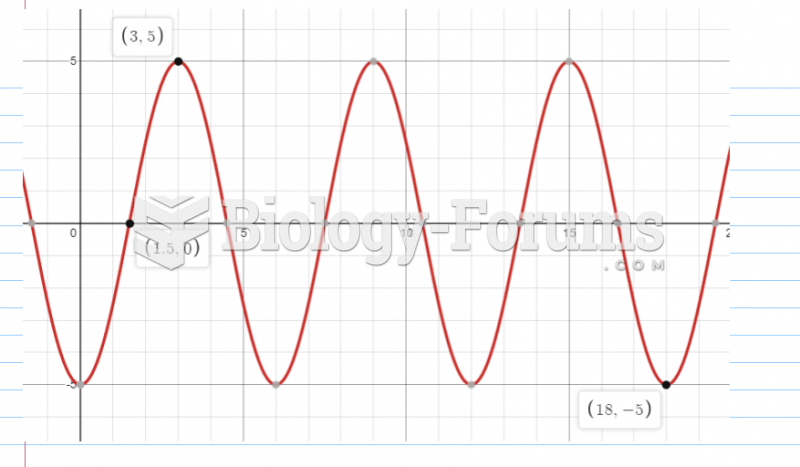 Sketch a graph of the function h(x), by hand on the following interval: