How can the influence of a third variable be shown on a two-dimensional graph?
A) by allowing the position of the relationship line or curve to shift on the graph
B) by super-imposing the third variable on the two-dimensional graph
C) by drawing a third axis coming out of the two axes
D) by allowing the relationship to be nonlinear
Question 2
With the exception of during recessions, workers in Canada are eligible for unemployment benefits for about twice as long a period of time as workers in the United States. As a result,
A) frictional unemployment is higher, on average, in the United States than in Canada.
B) the opportunity cost of job search in Canada is lower than in the United States.
C) the average duration of unemployment is longer in the United States than in Canada.
D) the unemployment rate in Canada is usually higher than in the United States.

 One danger of a wire fence is that, as shown in this photo, it is practically invisible; a running a
 Native American casinos remain a topic of both controversy and envy. Shown here is Corey Two Crow as ...
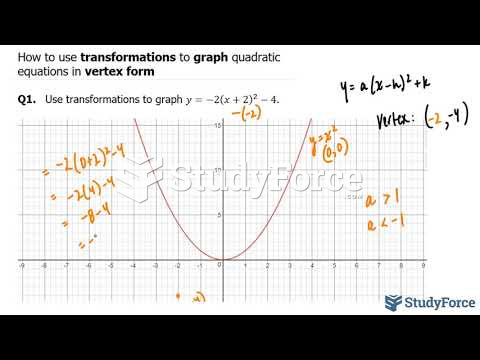 How to use transformations to graph quadratic equations in vertex form
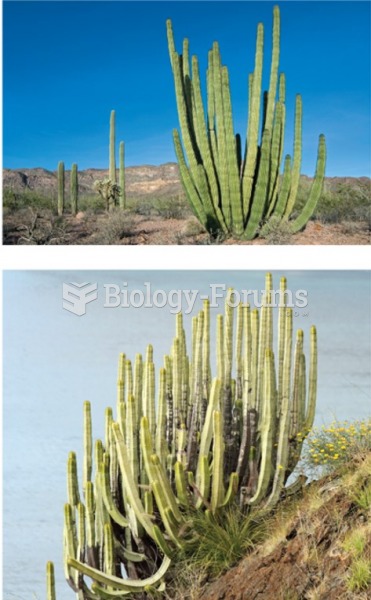 Selective pressures from the environment influence adaptation
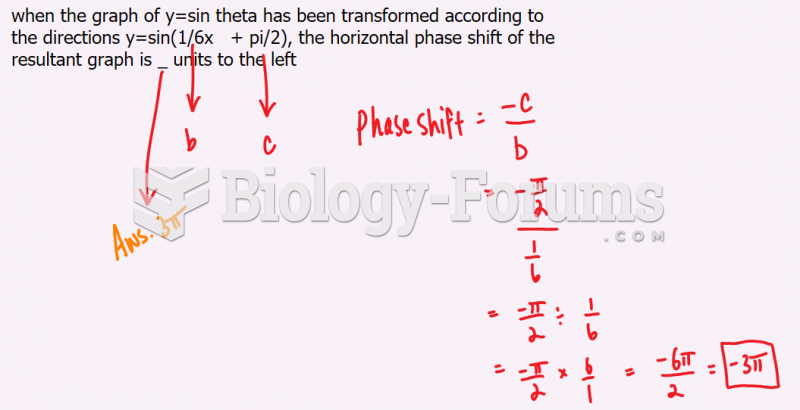 The horizontal phase shift of the resultant graph is
 calculus homework graph help please