|
|
|

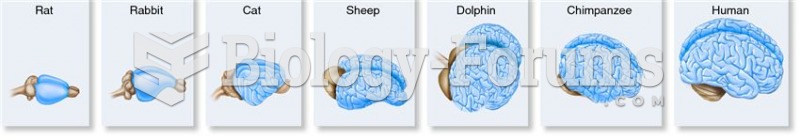 The degree of cerebral cortex folding in different mammalian species. The brains are not shown to sc
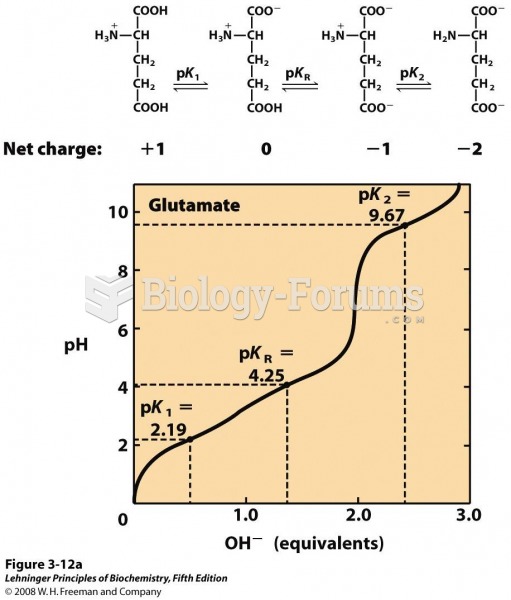 Titration curves for (a) glutamate and (b) histidine
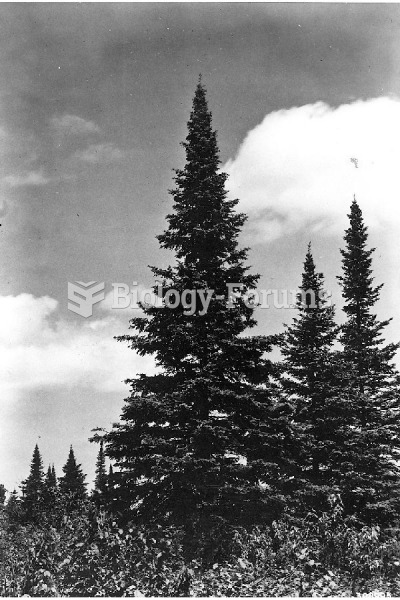 Plant
Plant
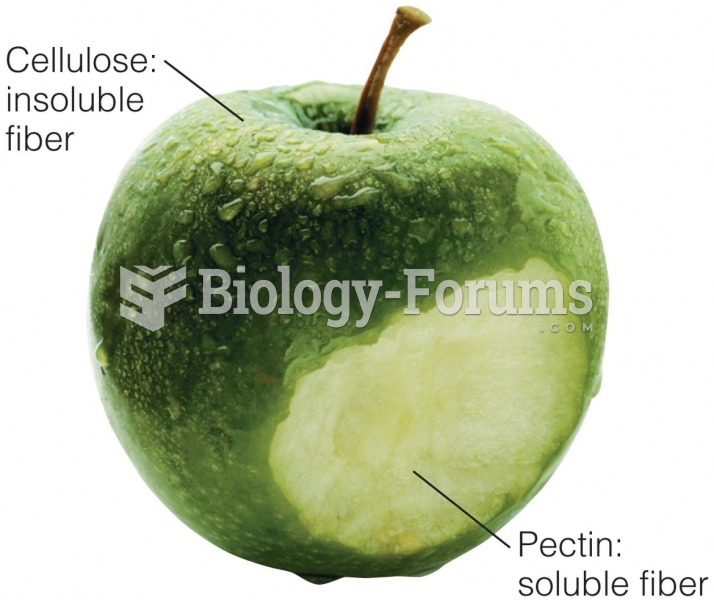 Most Plant Foods Contain Both Soluble and Insoluble Fibers
 Figure and Ground
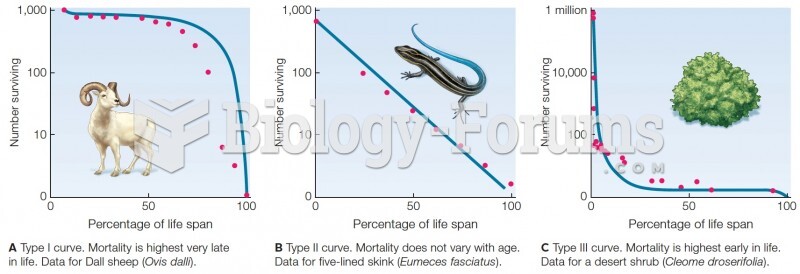 Survivorship curves. Blue lines are theoretical curves. Red dots are data from field studies.