|
|
|

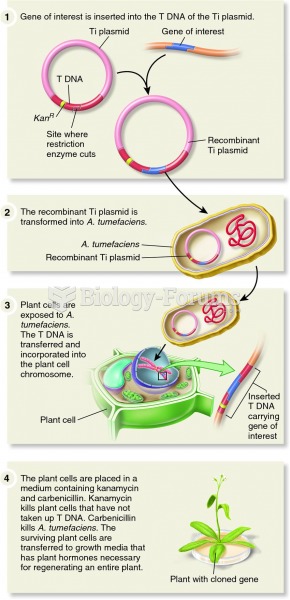 Using the Ti plasmid and Agrobacterium tumefaciens to make transgenic plants
 Booker T. Washington in his office at Tuskegee Institute, 1900. Washington chose a policy of accommo
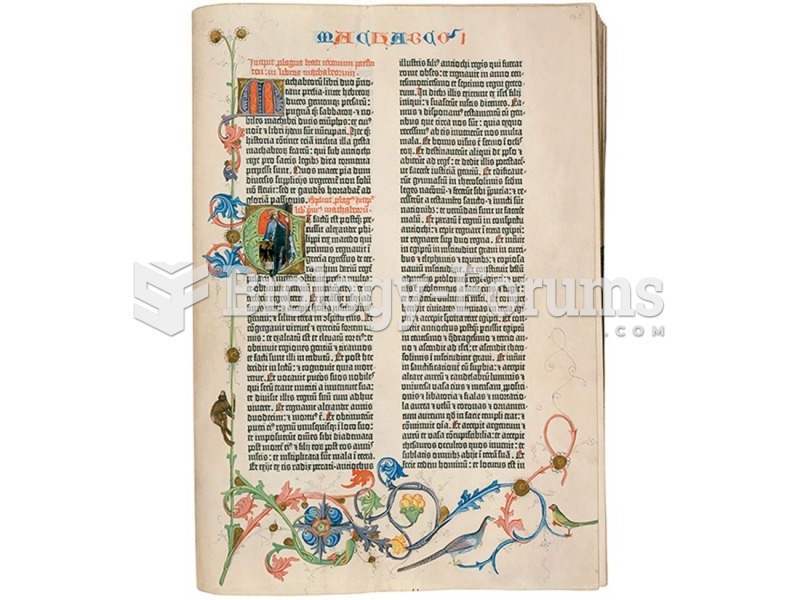 Johannes Gutenberg, Page from the Forty-Two-Line Bible, Mainz.
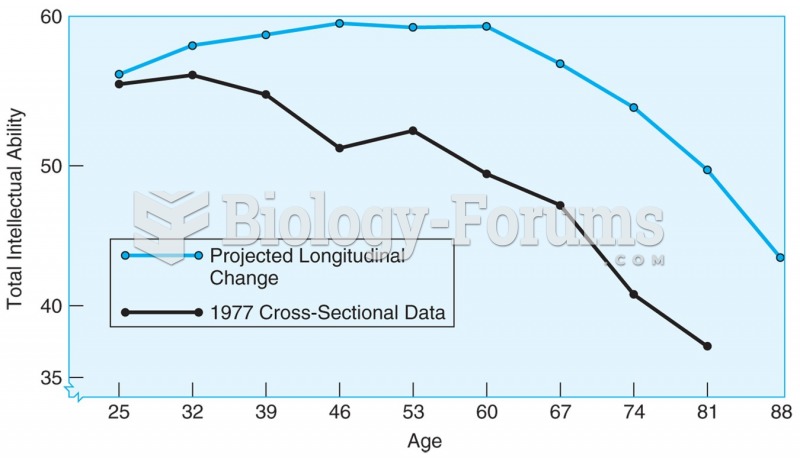 4.1 Age changes in total IQ based on cross-sectional data (lower line) and longitudinal data ...
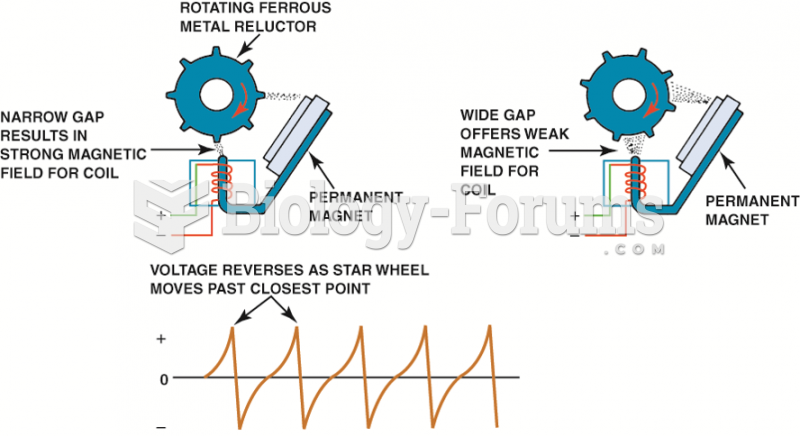 Operation of a typical pulse generator (pickup coil). At the bottom is a line drawing of a typical ...
 The purpose of mitosis is to take diploid cells and make two identical clones. A shows a simplified