|
|
|

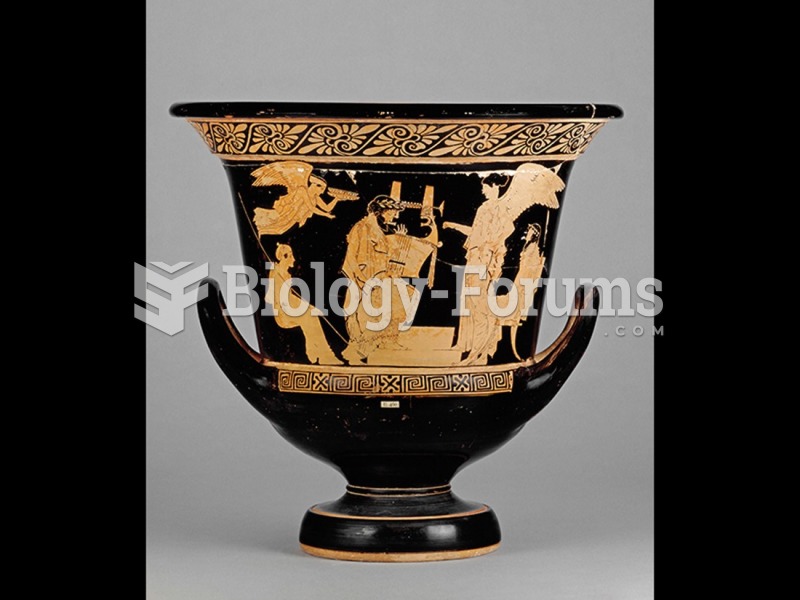 Attributed to the Manner of Peleus Painter, Red-figure calyx-krater.
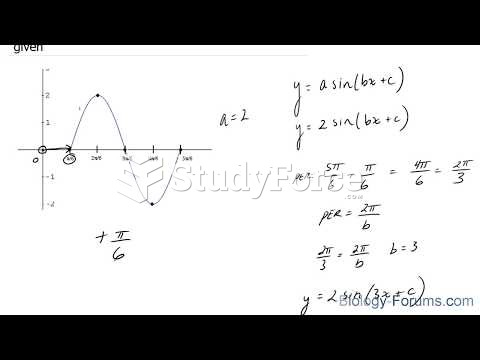 How to create a sine equation when the curve is given
 Mobilize hand and wrist joints. Apply scissoring to knuckles and figure-8s to fingers. Holding the ...
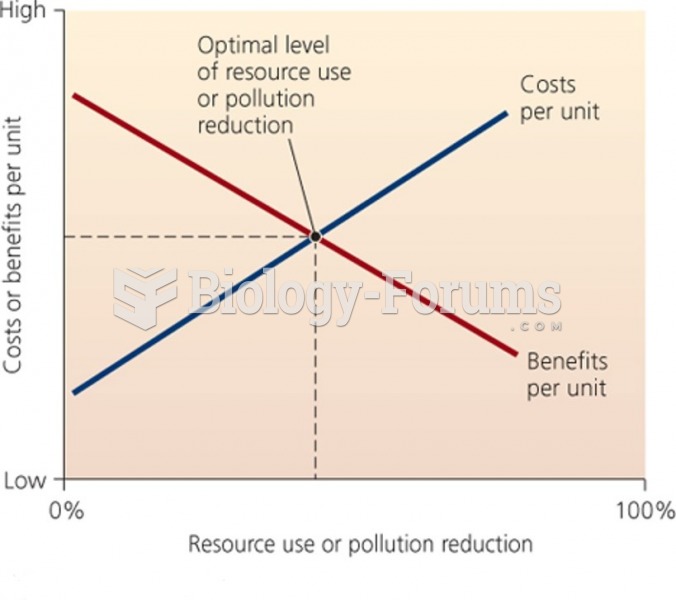 Marginal Supply - Demand Curve
 The Kuznets Curve
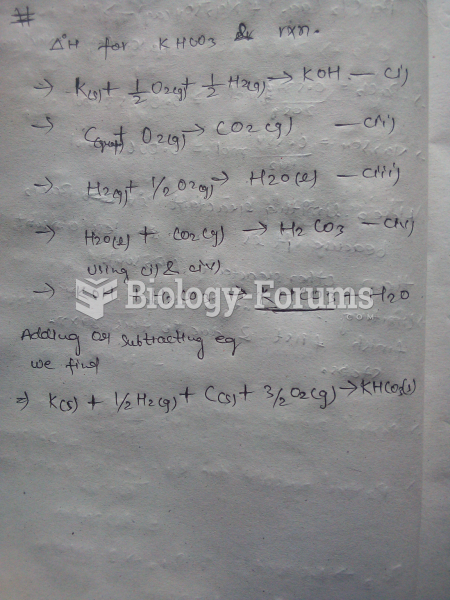 Choose the reaction that illustrates Hf for KHCO3.