This topic contains a solution. Click here to go to the answer
|
|
|

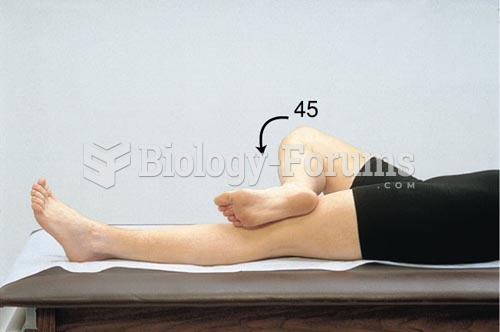 Range of Motion of the Hip Joint, Position of the Leg for Full External Rotation
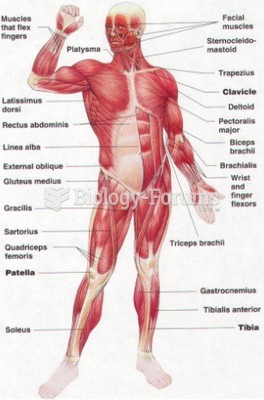 front muscle figure
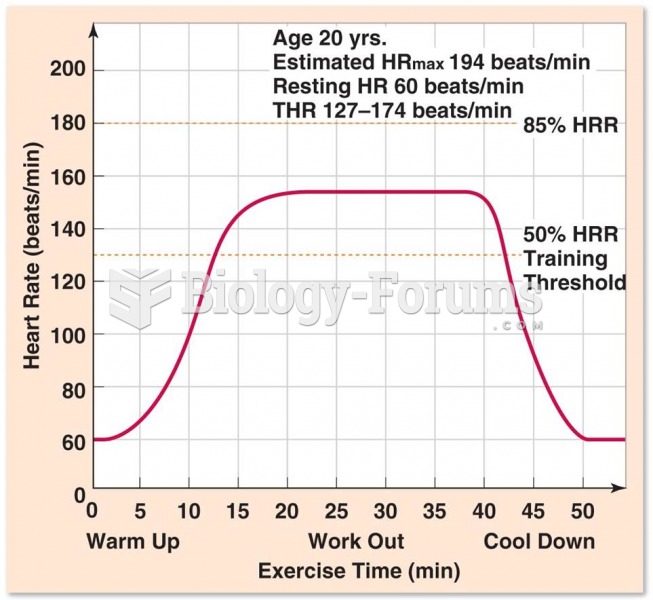 Sample Workout in the Target Heart Rate Range
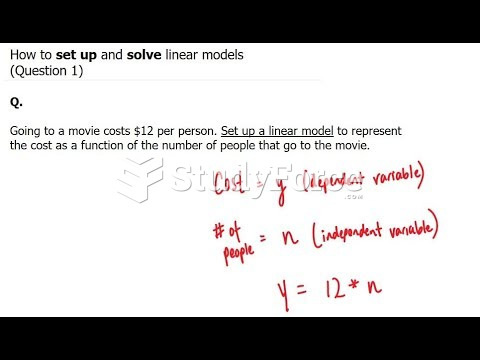 How to set up and solve linear models (Question 1)
 How to determine the interquartile range
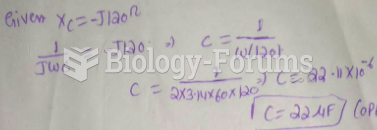 If the frequency equals 60 Hz in Figure 10-1, what is the value of capacitance?