|
|
|

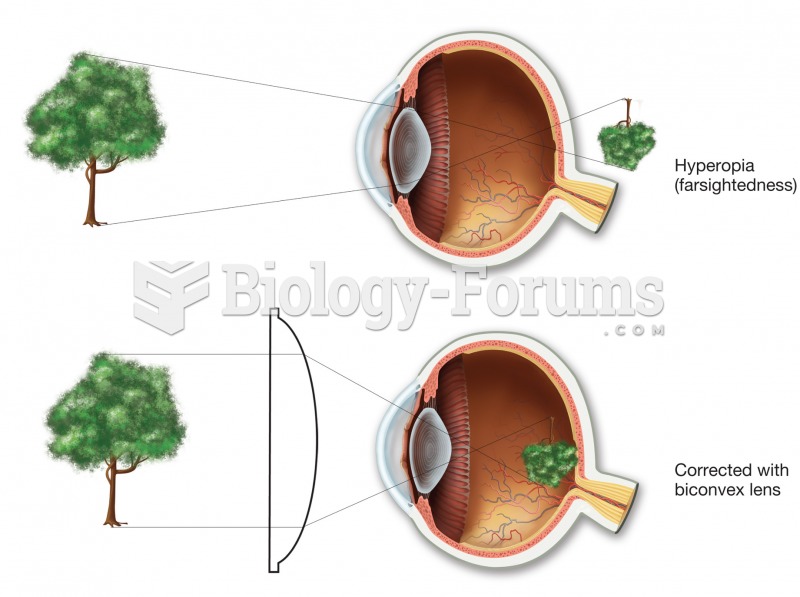 Hyperopia (farsightedness). In the uncorrected top figure, the image would come into focus behind th
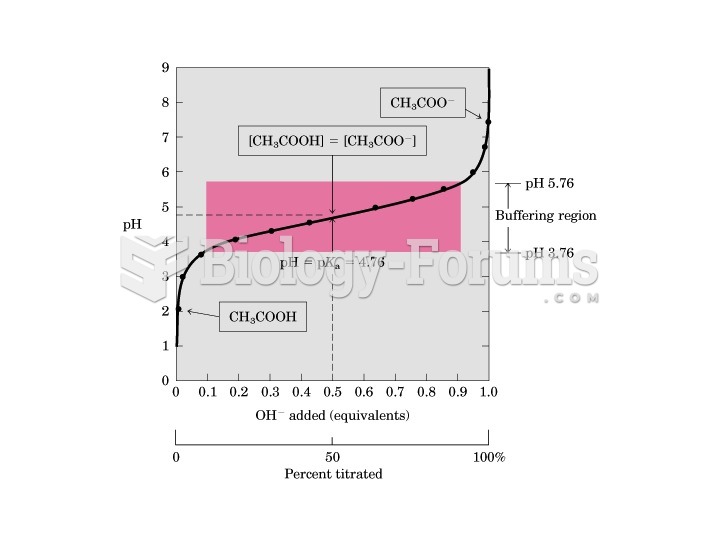 Titration Curve
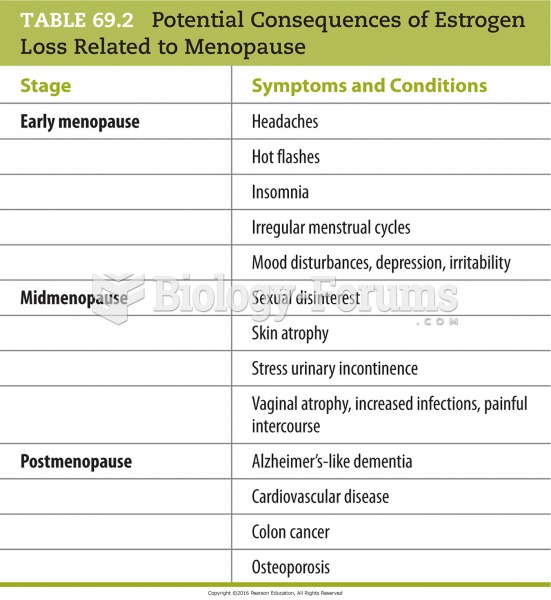 Potential Consequences of Estrogen Loss Related to Menopause
 Metastatic spread of the tumor shown with imaging techniques.
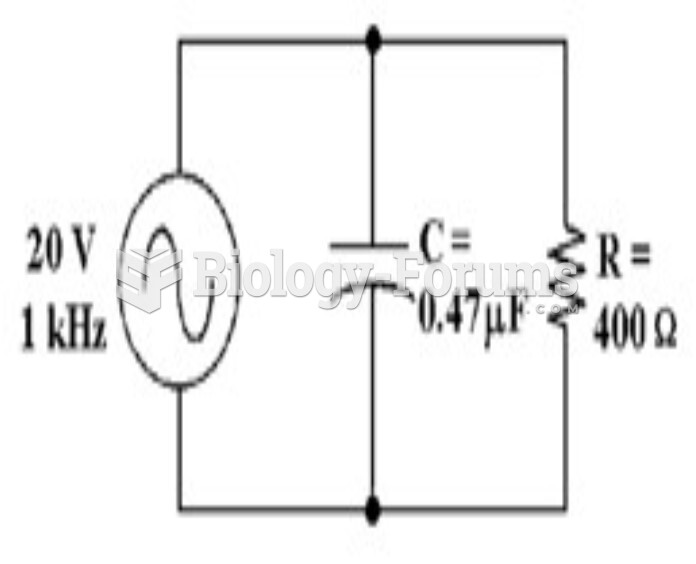 How much voltage does the resistor drop in Figure 10-2?
 Construct a Lorenz curve that shows income distribution in this society.