Which of the following could have led to the shifts illustrated in the figure above?
i. The U.S. exchange rate was expected to depreciate between 2001 and 2009.
ii. The U.S. exchange rate was expected to appreciate between 2001 and 2009.
iii. The U.S. interest rate rose relative to interest rates in other countries between 2001 and 2009.
A) i only B) ii only C) iii only D) i and iii E) ii and iii
Question 2
In the figure below, label the axes and then draw a demand for money curve. Illustrate an increase in the demand for money.
What will be an ideal response?

 Zygotic life cycle, illustrated by the unicellular flagellate genus Chlamydomonas
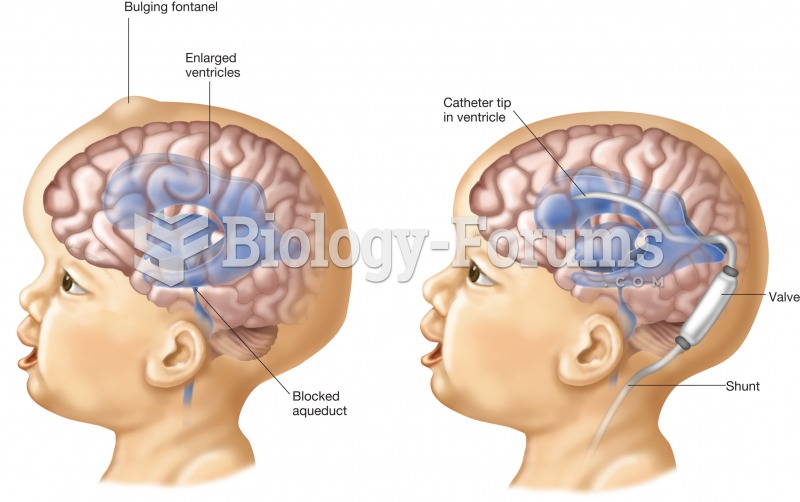 Hydrocephalus. The figure on the left is a child with the enlarged ventricles of hydrocephalus. The
 Statuette of a Male Figure
 EYEMA-O-BYERI (Reliquary Figure)
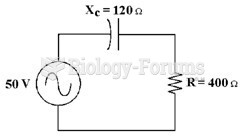 If the frequency equals 60 Hz in Figure 10-1, what is the value of capacitance?
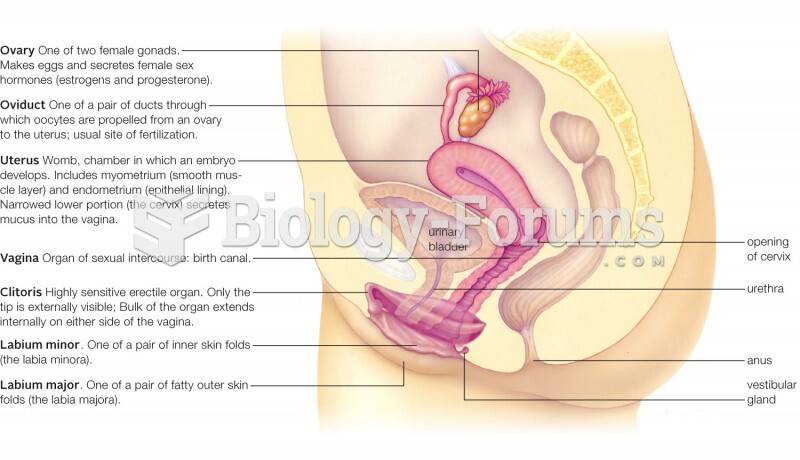 Female Reproductive System (Illustrated)