To show the values of an economic variable for different groups in a population at a point in time, it is best to use a
A) trend-section diagram.
B) cross-section graph.
C) linear graph.
D) time-series graph.
E) scatter diagram.
Question 2
The Q-theory of investment
A) suggests that a downturn in real GDP will lead to a sharp fall in investment, which leads to further reductions in GDP through the multiplier.
B) emphasizes the role of real interest rates and taxes.
C) emphasizes that current investment spending depends positively on the expected future growth of GDP.
D) links investment spending to stock prices.

 Controlled Experiments Manipulate a Variable
 Time Slows Down Near Matter
 Cultural values Exercise
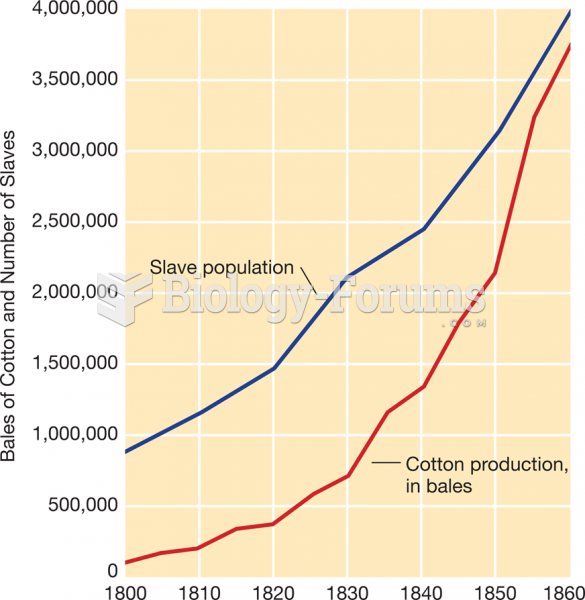 Cotton Production and Slave Population, 1800–1860
 Richmond, Virginia, lies in ruins in April 1865 at the time of Lincoln’s visit—and a few days before
 McBurney point.