To show the values of an economic variable for different groups in a population at a point in time, it is best to use a
A) trend-section diagram.
B) cross-section graph.
C) linear graph.
D) time-series graph.
E) scatter diagram.
Question 2
The Q-theory of investment
A) suggests that a downturn in real GDP will lead to a sharp fall in investment, which leads to further reductions in GDP through the multiplier.
B) emphasizes the role of real interest rates and taxes.
C) emphasizes that current investment spending depends positively on the expected future growth of GDP.
D) links investment spending to stock prices.

 A microsatellite locus can show linkage to a disease gene
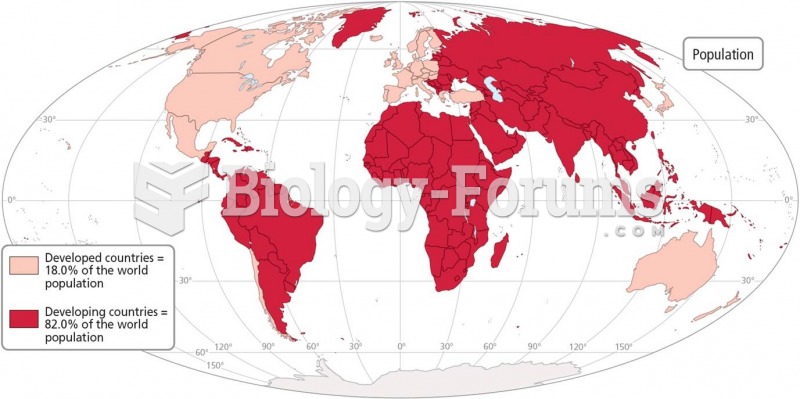 Worldwide Variations in Population and Income Levels Developed countries represent only 18% of the
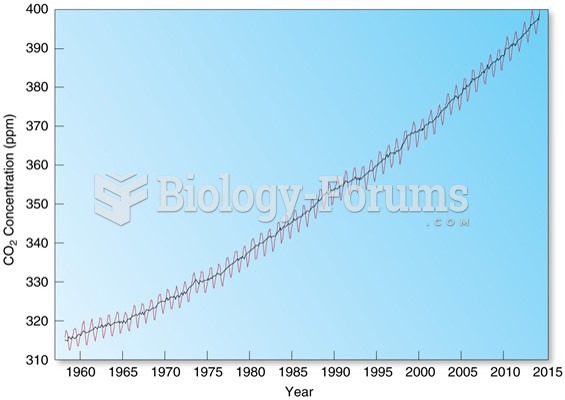 Variable Gases: Carbon Dioxide
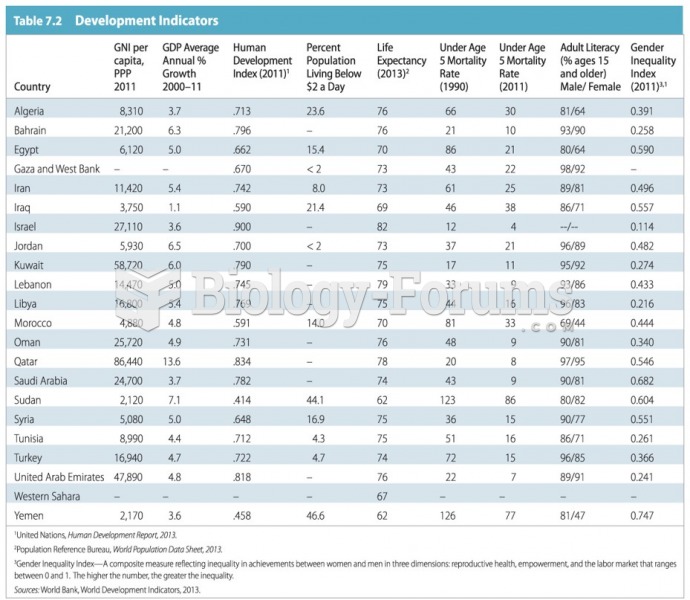 Economic and Social Development
 economic question (having trouble)
 Constructing a Three-Point Recombination Map