This topic contains a solution. Click here to go to the answer
|
|
|

 The Ford logo on display at the 2009 New York International Auto Show.
 Common Functional Groups Found in Biomolecules
 The time at which the mailman delivers the mail to Ace Bike Shop follows a normal distribution ...
 In order to encourage Canadians to avoid cross border shopping, Walmart Canada is striving to ...
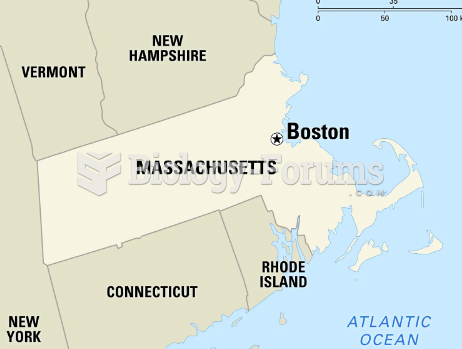 Locate the following places by reference number on the map:Key Locales of Political, Economic, ...
 Time homework