This topic contains a solution. Click here to go to the answer
|
|
|

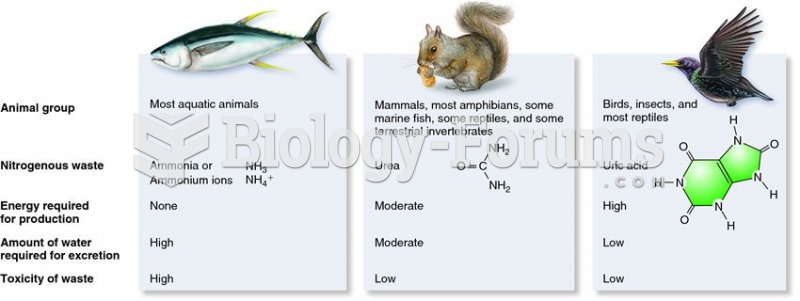 Nitrogenous wastes produced by different animal groups.
 The male reproductive system, sagittal section showing the organs of the system and their relation t
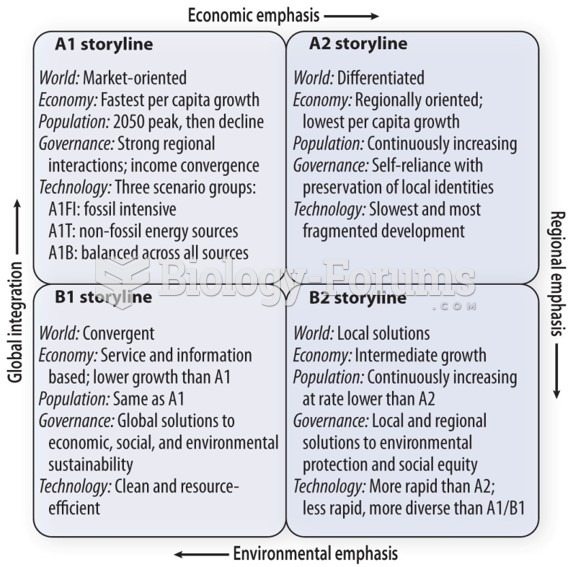 IPCC economic scenarios
 People with night eating syndrome may consume more than half their day's calories between 8 pm ...
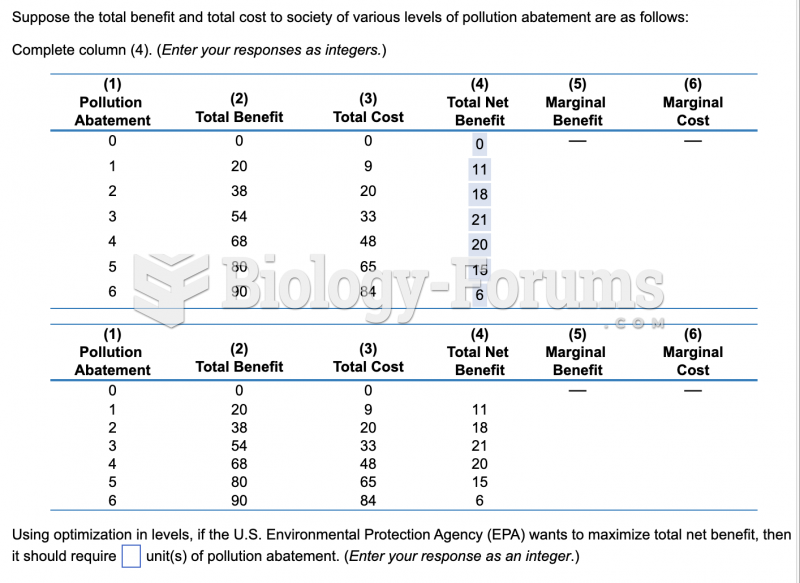 economic question
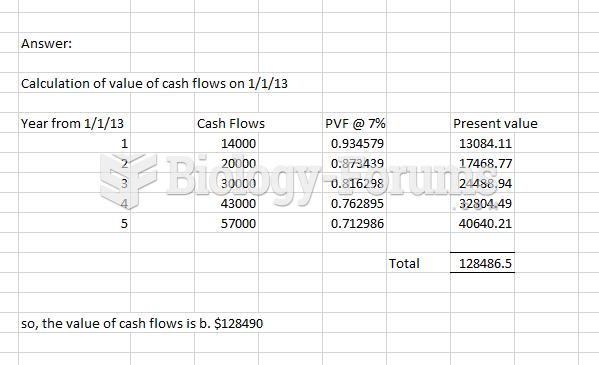 Time value money