|
|
|

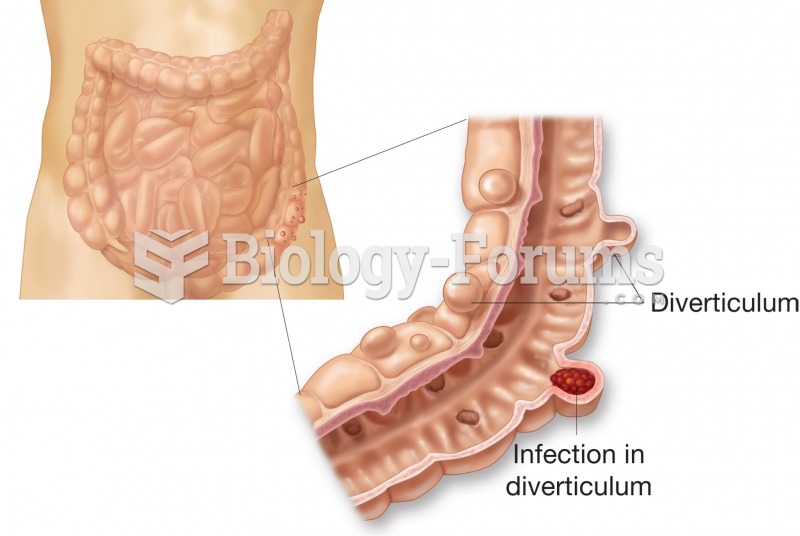 Diverticulosis. Figure illustrates external and internal appearance of diverticula.
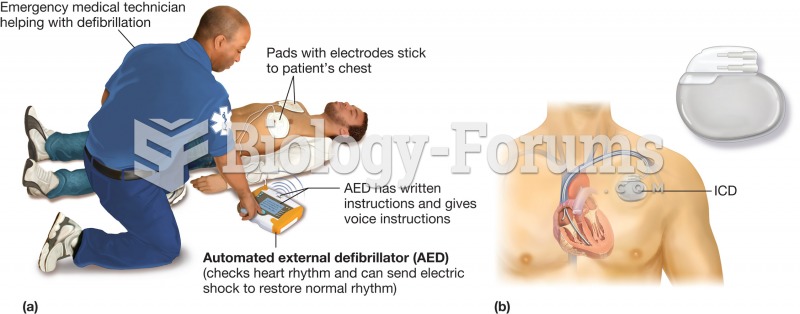 Defibrillator. Defibrillators are devices that supply a voltage charge to the heart in the hope of r
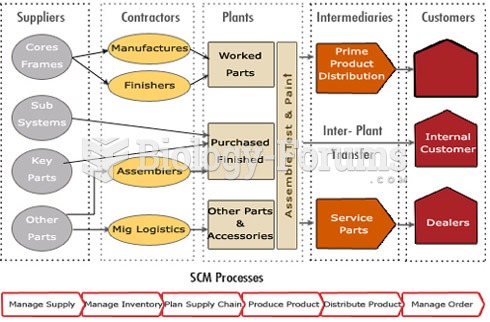 supply chain
 Economic recession in 2008 saw a small decrease in demand
 Figure and Ground
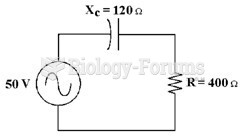 If the frequency equals 60 Hz in Figure 10-1, what is the value of capacitance?