This topic contains a solution. Click here to go to the answer
|
|
|

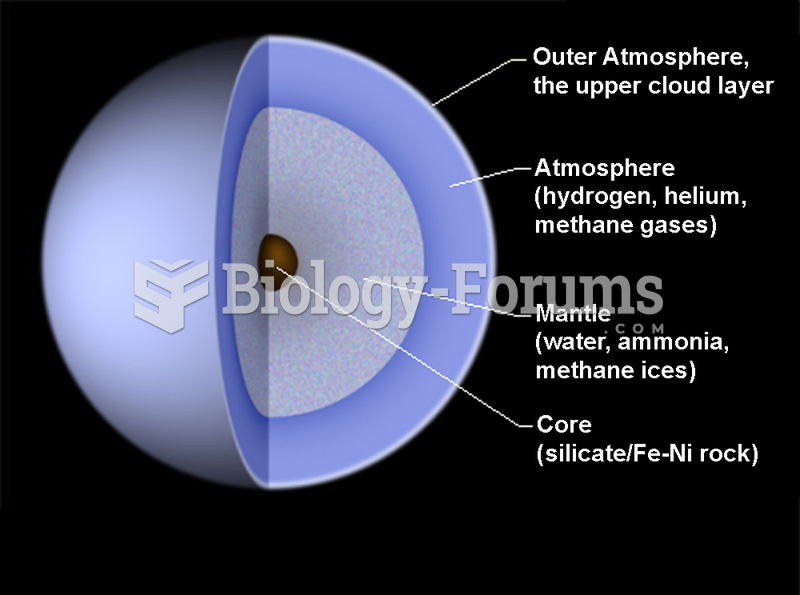 Diagram of the interior of Uranus
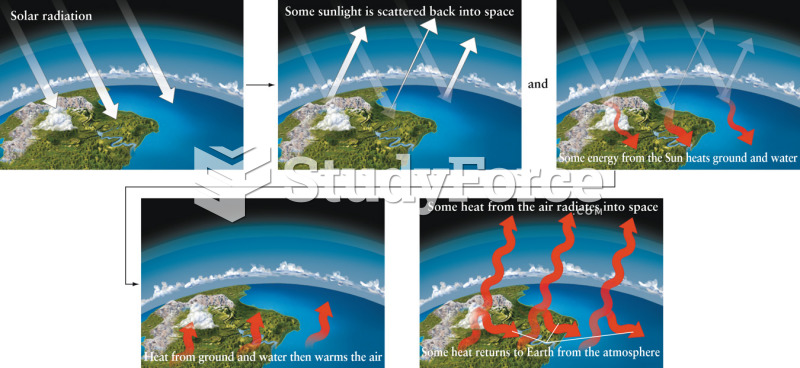 The Greenhouse Effect
 This girl’s photo illustrates the main features of fetal alcohol syndrome, including a flat nasal ...
 Is the principle of cause and effect unfounded?
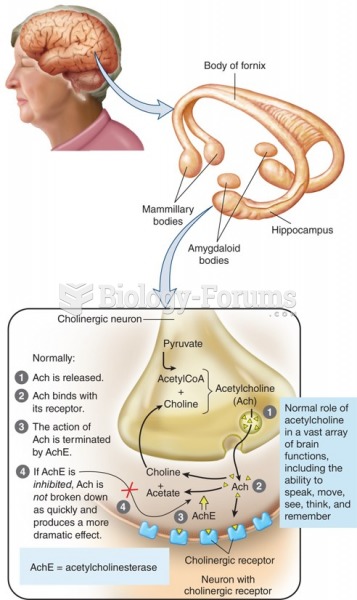 Alzheimer’s medications work by intensifying the effect of acetylcholine at the receptor.
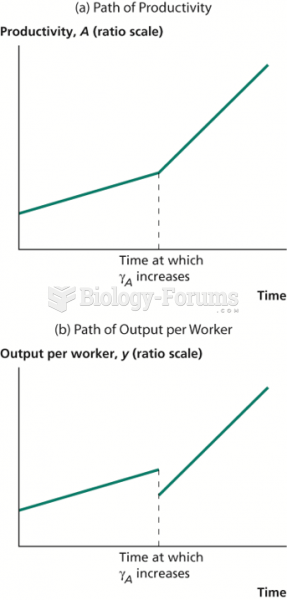 Effect of Shifting Labor into R&D