|
|
|

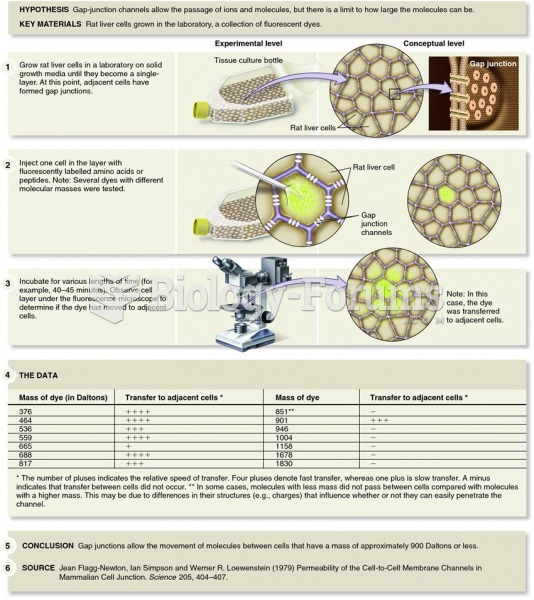 Use of fluorescent molecules by Lowenstein and colleagues to determine the size of gap-junction chan
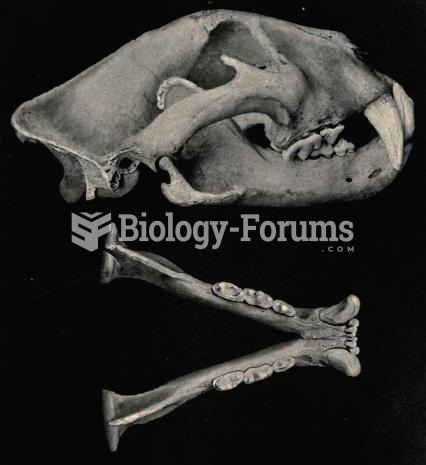 The head of the jaguar is robust and the jaw extremely powerful. The size of jaguars tends to increa
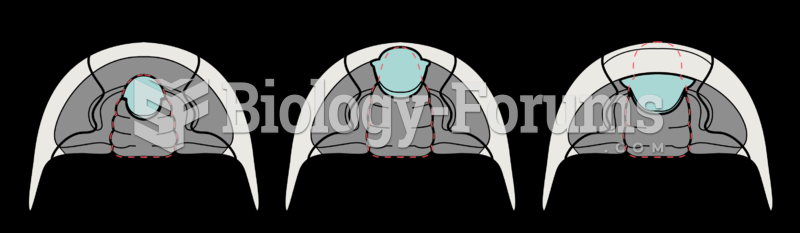 Trilobite hypostome types based on attachment
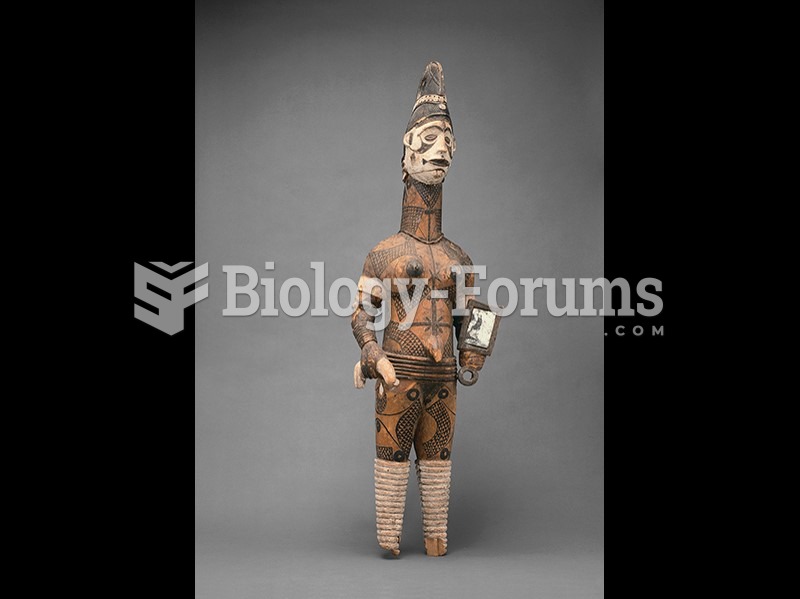 Ugonachomma display figure, Igbo, Nigeria.
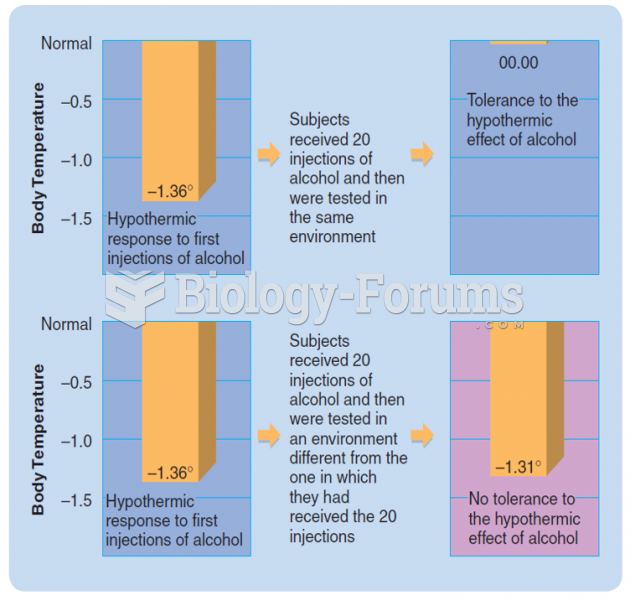 The situational specificity of tolerance to the hypothermic effects of alcohol in rats. (Based on ...
 A schematic view of ribosome subunit rotational motions, based on crystal structures of ribosomes