|
|
|

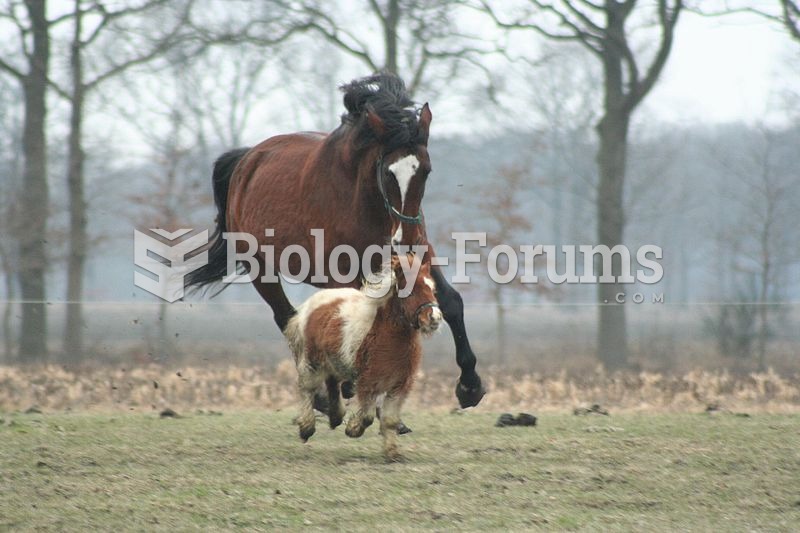 Size varies greatly among horse breeds, as with this full-sized horse and a miniature horse.
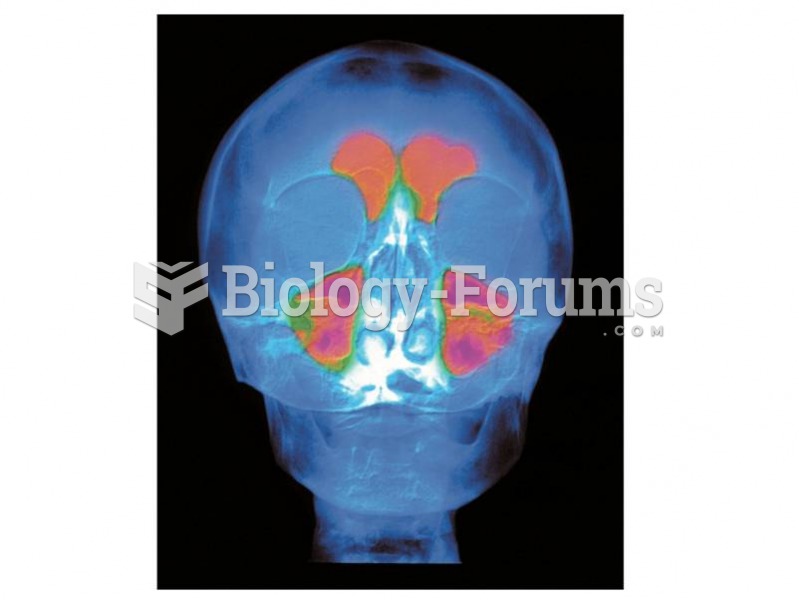 The frontal sinus, an airfilled space just behind the brow, is a unique size and shape in each of us
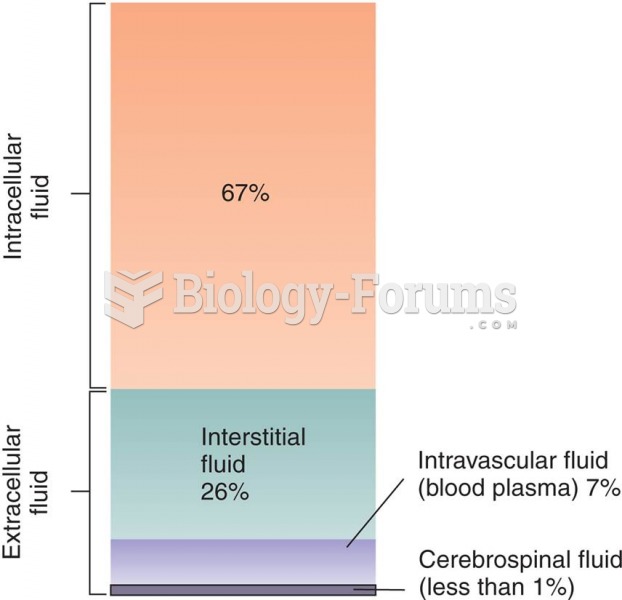 Relative Size of the Body’s Fluid Compartments
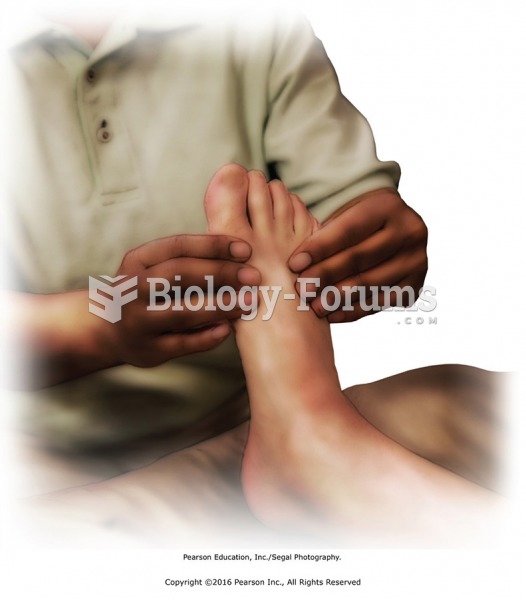 Mobilize joints of the feet and ankle. Apply scissoring to metatarsals and figure-8s to toes. Dorsi- ...
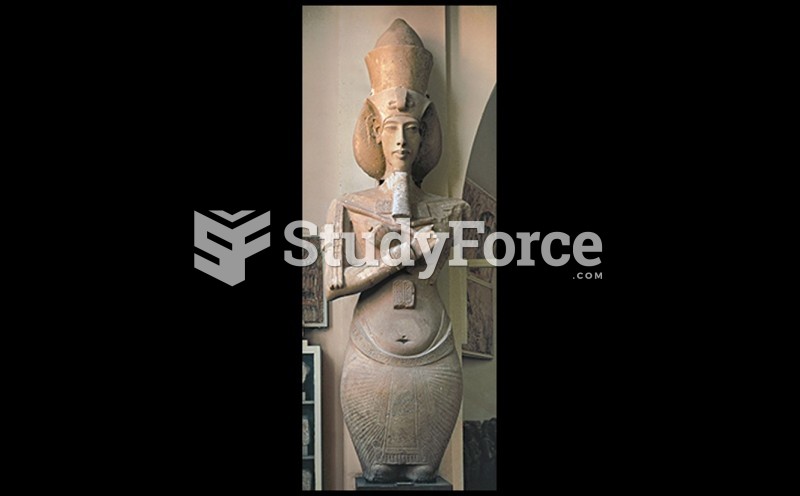 Colossal Figure of Akhenaten
 Bayesian Analysis of the Genotype of II-2 in Figure A.4