|
|
|

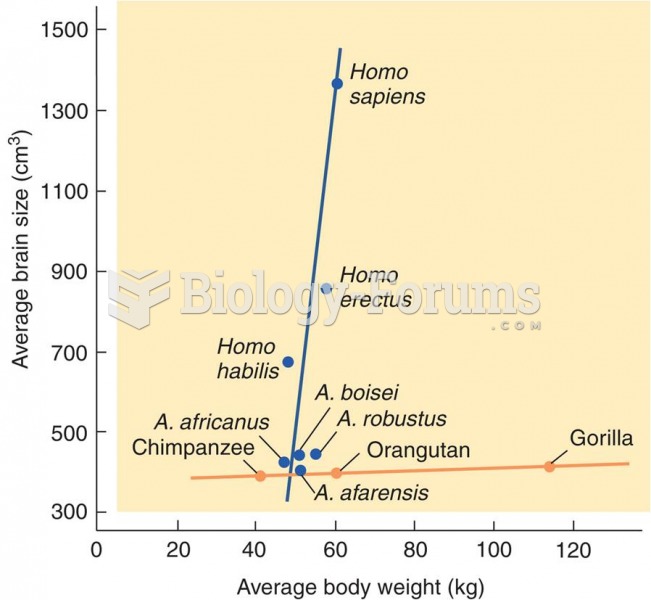 Hominid Brain Size
 Demonstrate the Application of Triangular, Figure-Eight, and Tubular Bandages
 Basic classification of streptococci-based on hemolysis.
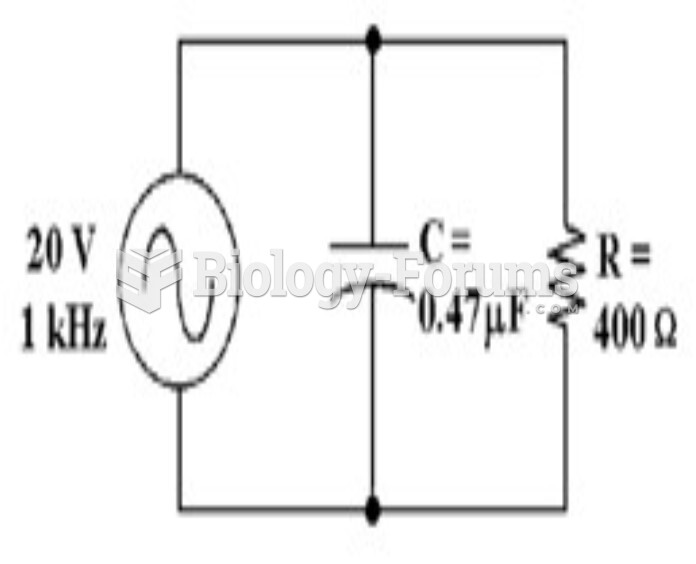 How much voltage does the resistor drop in Figure 10-2? a. 59 mV b. 19.94 V c. 20 V d. 10 V
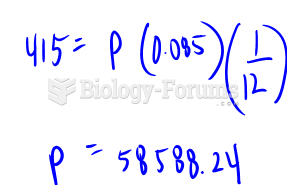 Philip wants to supplement his pension by $415 per month with income from his investments. His ...
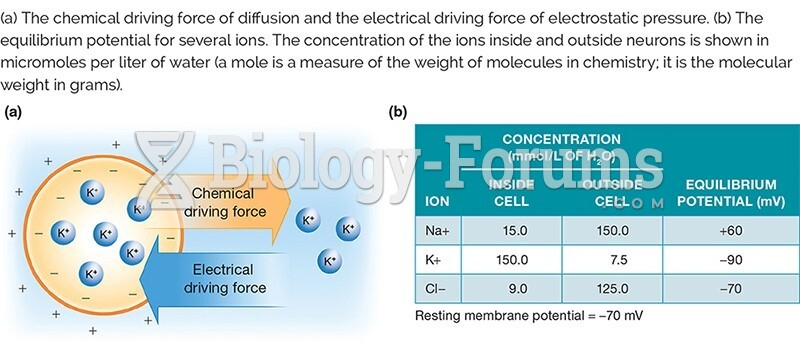 Figure 2.15.jpg