This topic contains a solution. Click here to go to the answer
|
|
|

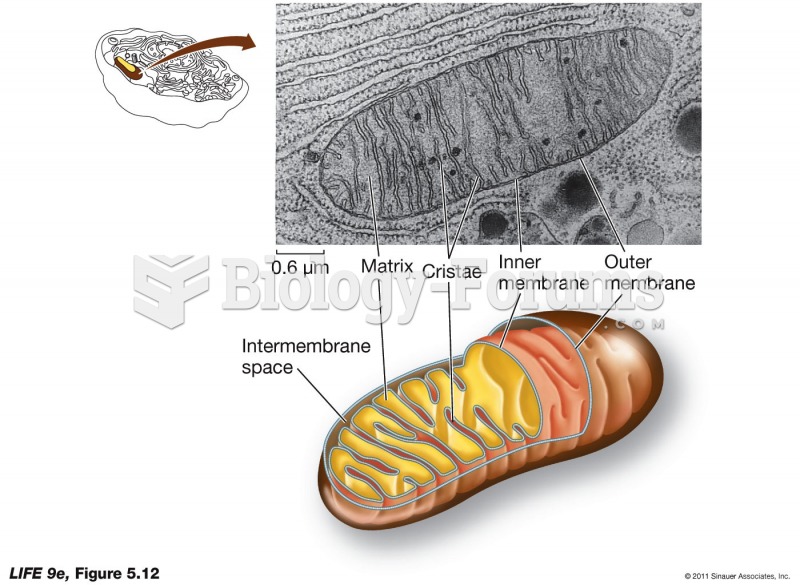 A Mitochondrion Converts Energy from Fuel Molecules into ATP
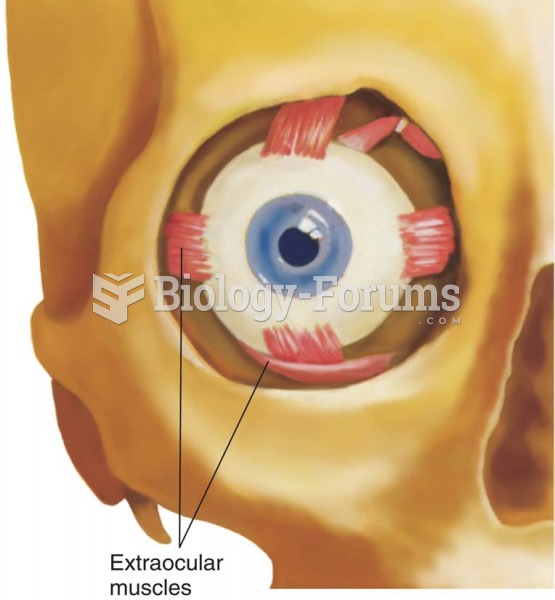 The Extraocular Muscles, Which Move the Eyes
 Sheryl Crow - If It Makes You Happy
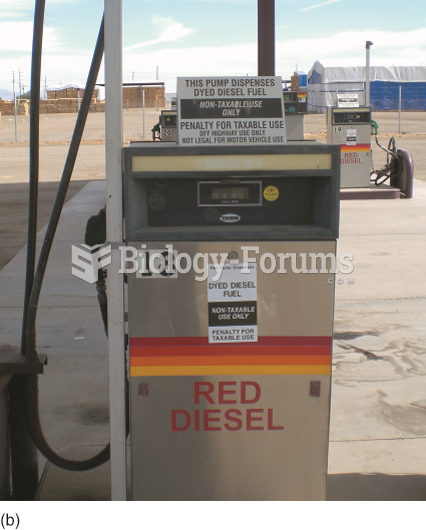 A fuel pump in a farming area that clearly states the red diesel fuel is for off-road use only ...
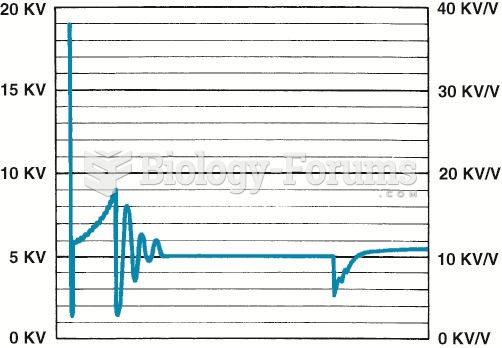 An upward-sloping spark line usually indicates a mechanical engine problem or a lean air–fuel ...
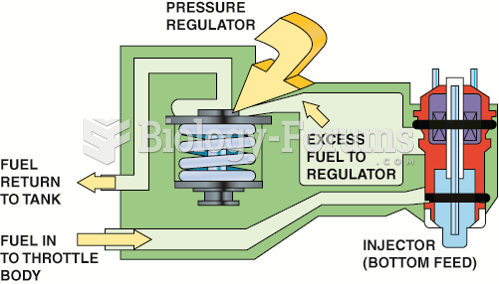 The tension of the spring in the fuel-pressure regulator determines the operating pressure on a ...