|
|
|

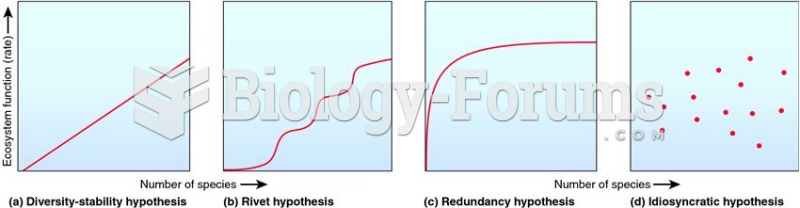 Four main models that describe the relationship between ecosystem function and biodiversity.
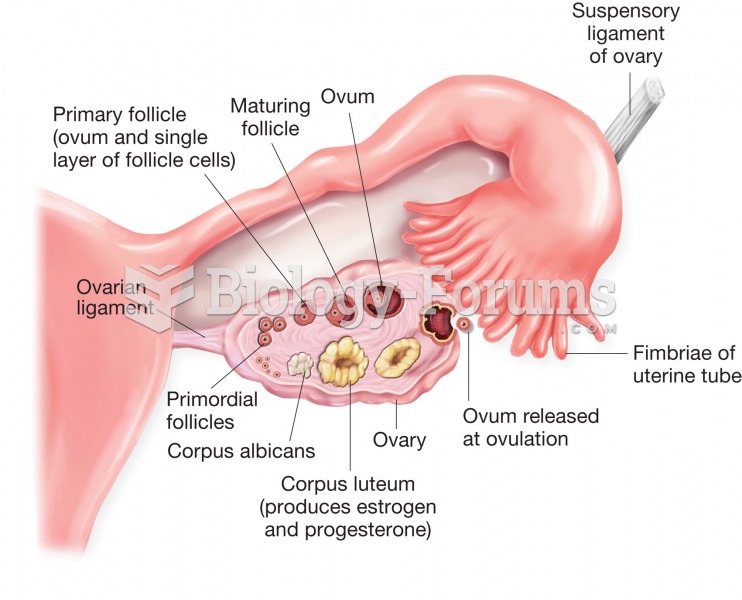 Structure of the ovary and uterine (fallopian) tube. Figure illustrates stages of ovum development a
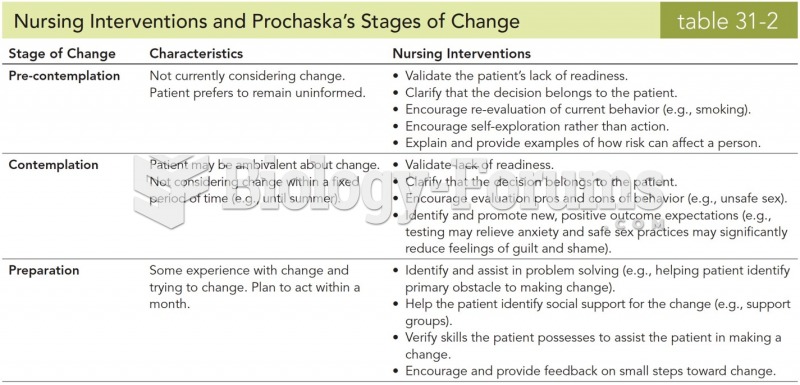 Nursing Interventions and Prochaska's Stages of Change
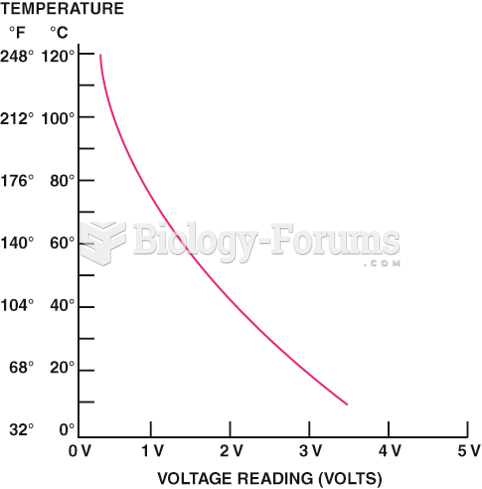 A typical ECT sensor temperature versus voltage curve.
 Climate Change
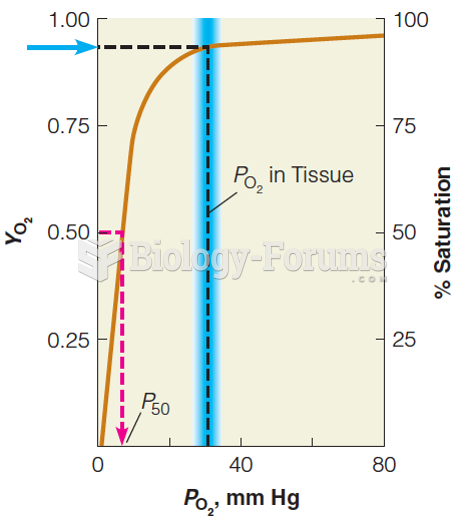 Oxygen-binding curve for myoglobin