|
|
|

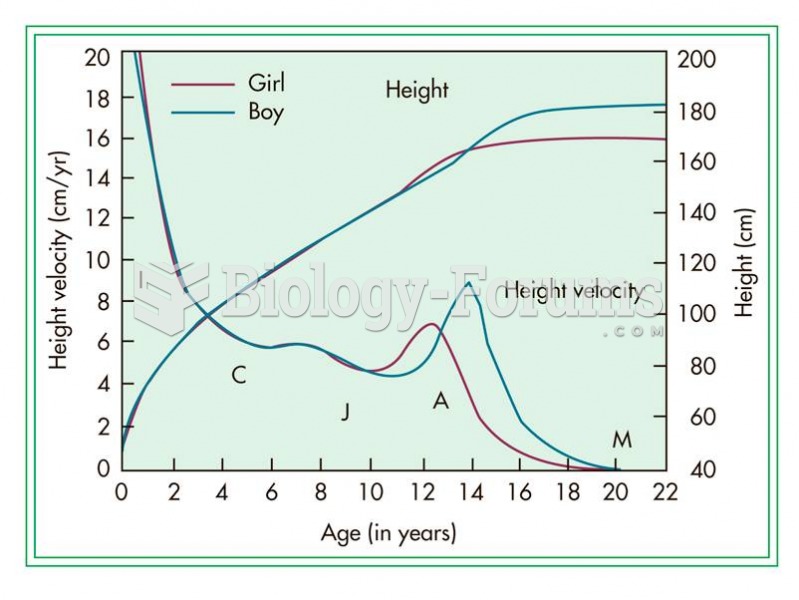 The adolescent growth spurt in humans is seen as a “bump” in the height curve and a “spike” in the h
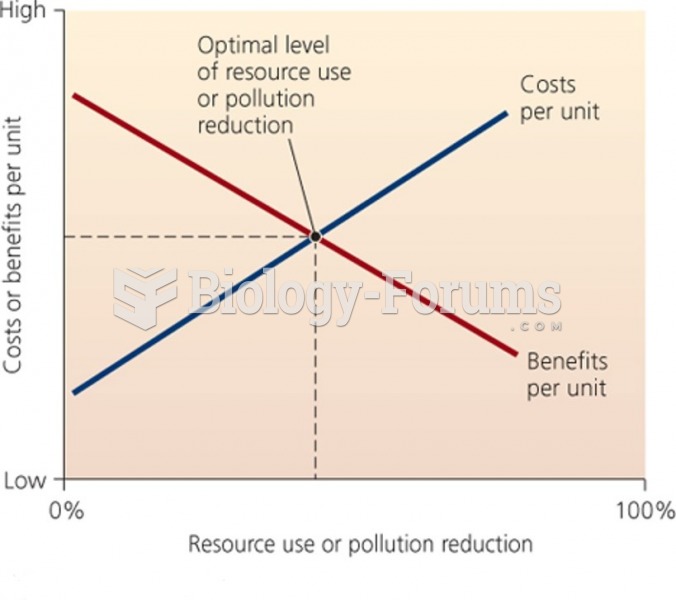 Marginal Supply - Demand Curve
 For each function f(x) = 6x^2 - 4, estimate the instantaneous rate of change for the given ...
 Construct a Lorenz curve that shows income distribution in this society.
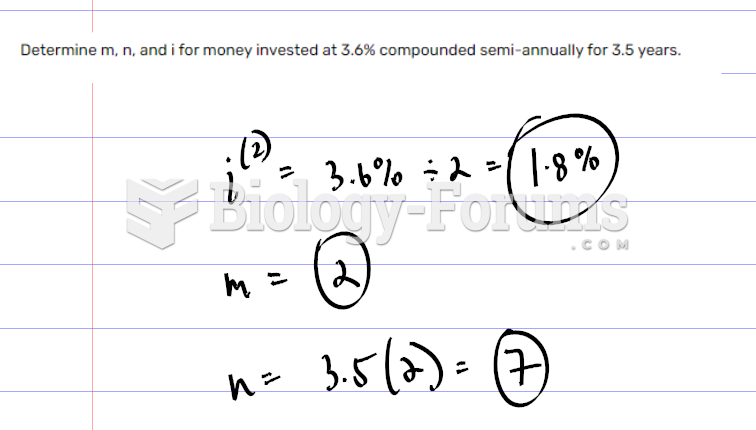 Determine m, n, and i for money invested at 3.6% compounded semi-annually for 3.5 ...
 Relationship of a DNA base sequence to peptide structure