|
|
|

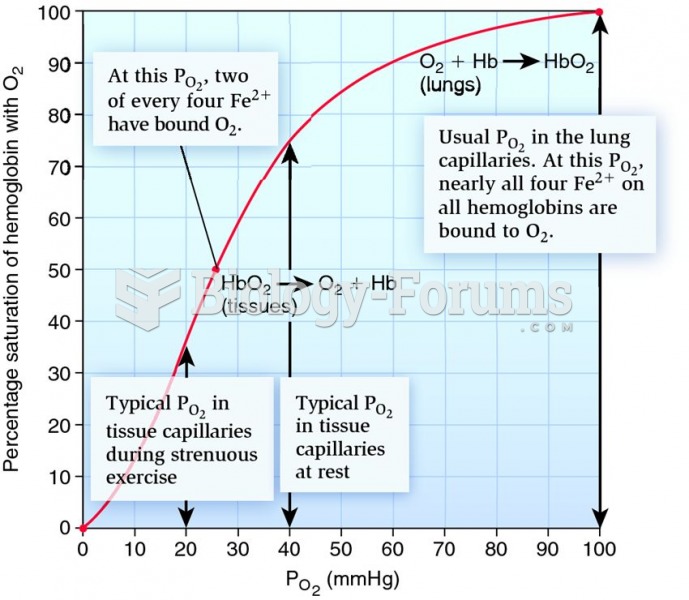 The human oxygen-hemoglobin dissociation curve.
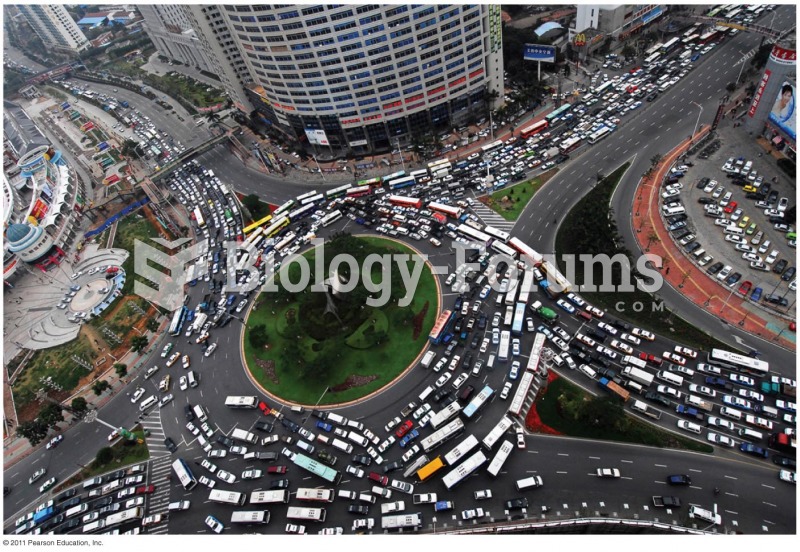 An Oil-dependent World— Supply and Demand Driven
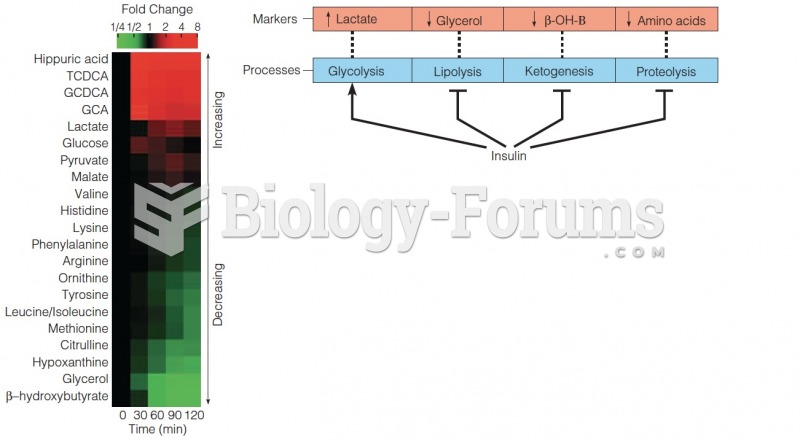 Change in plasma metabolomics following glucose igestion
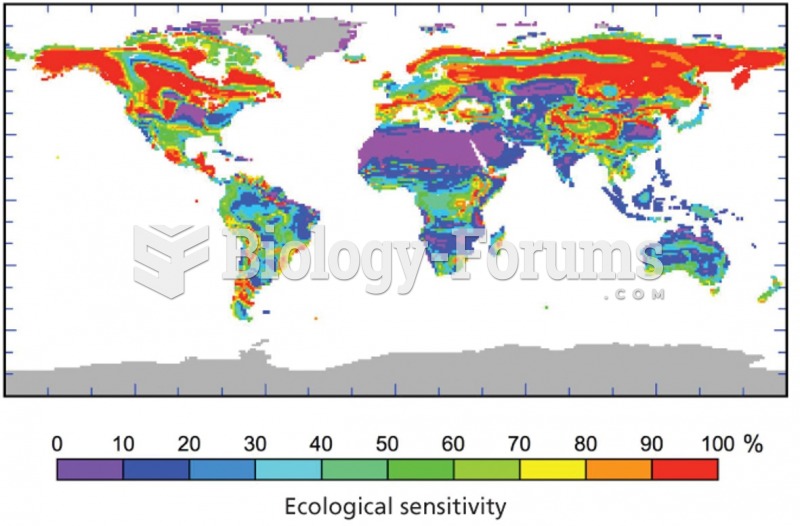 Ecological sensitivity to climate change
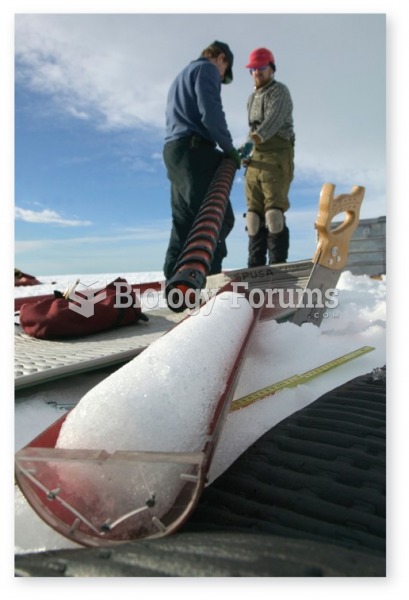 Ice cores as indicators of environmental change
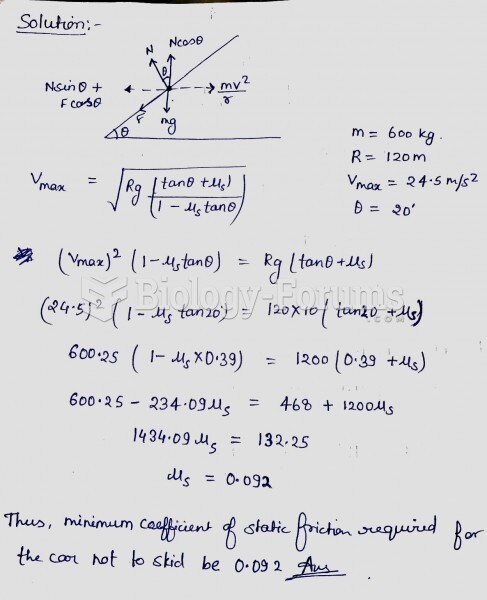 A 600-kg car is going around a curve with a radius of 120 m that is banked at an angle of 20° ...