|
|
|

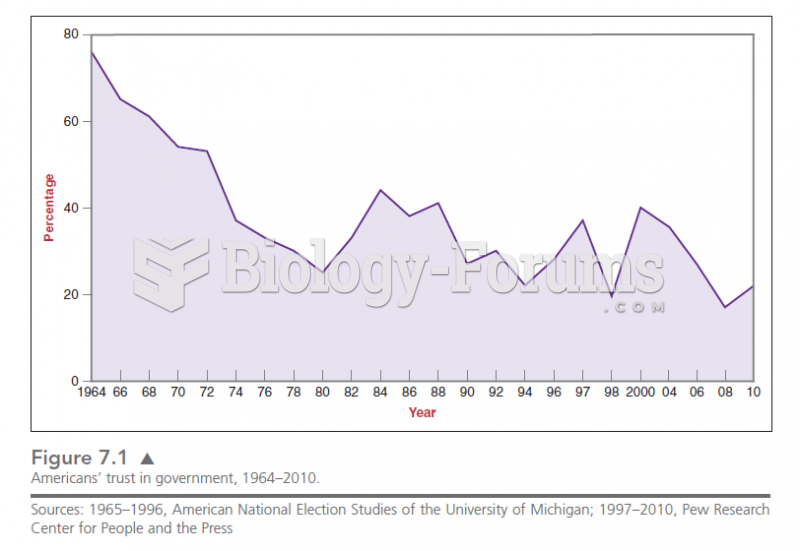 Figure 7.1 shows the rapid decline in the trust of Americans in government since the 1960s. This de
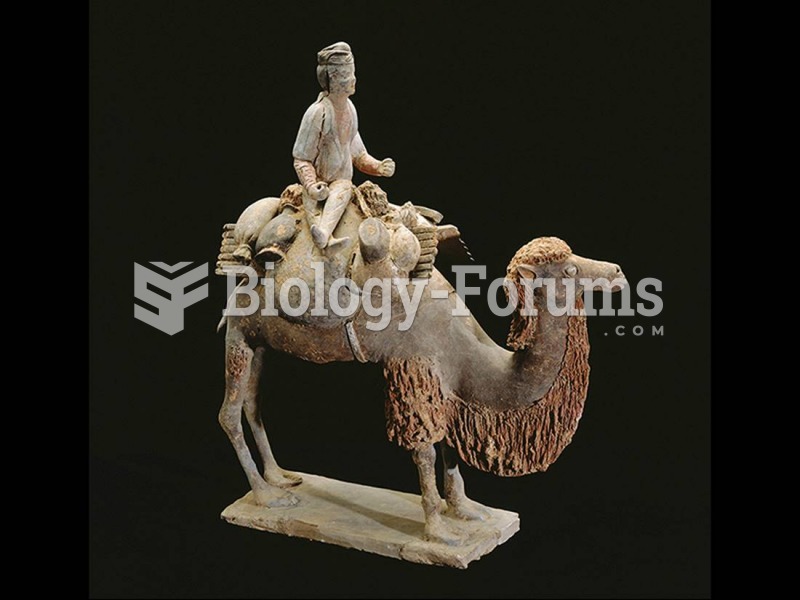 Caravaneer on a camel, China. Tang dynasty, (618–907). Polychrome terra-cotta figure.
 Attributed to the Manner of Peleus Painter, Red-figure calyx-krater.
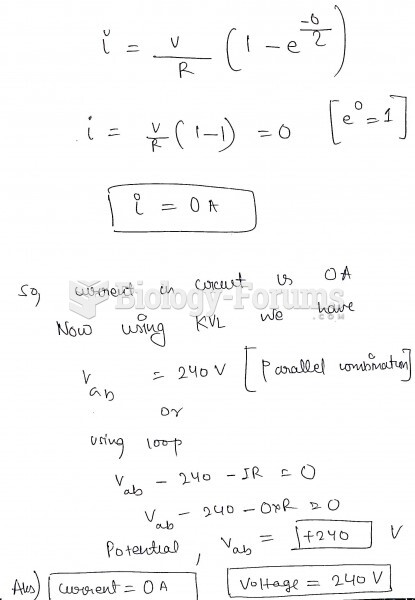 The figure shows an LR circuit with a switch and a 240-volt battery. At the instant the switch ...
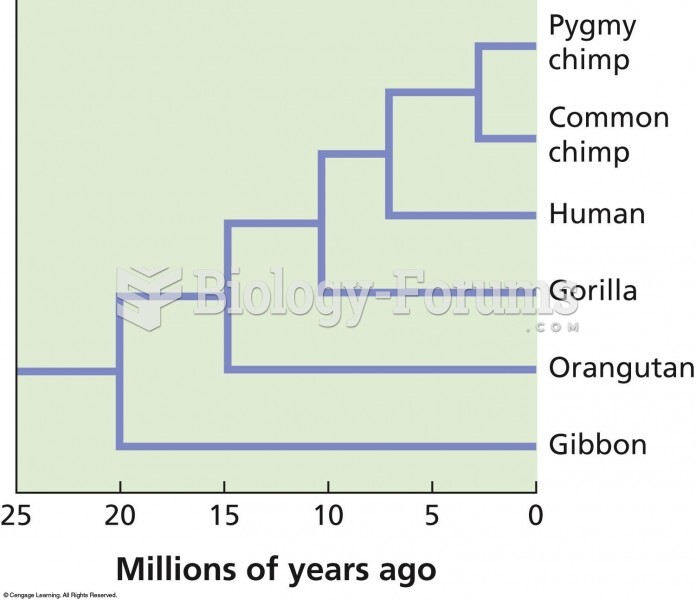 A phylogenetic tree showing the evolutionary relationships among hominoids. The evidence shows that
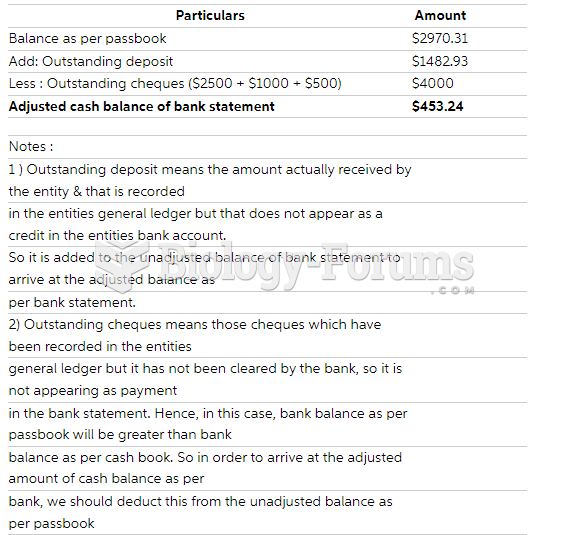 A bank statement shows a balance of $2,970.31 The check register of the account owner shows an ...