|
|
|

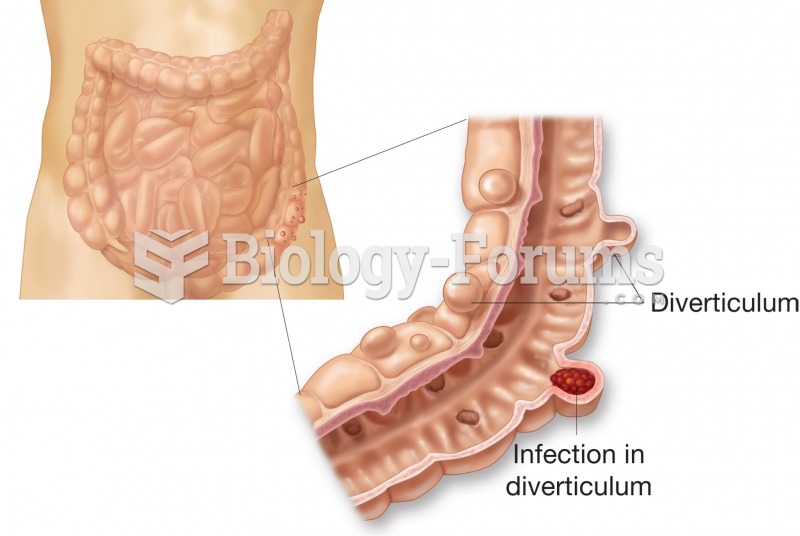 Diverticulosis. Figure illustrates external and internal appearance of diverticula.
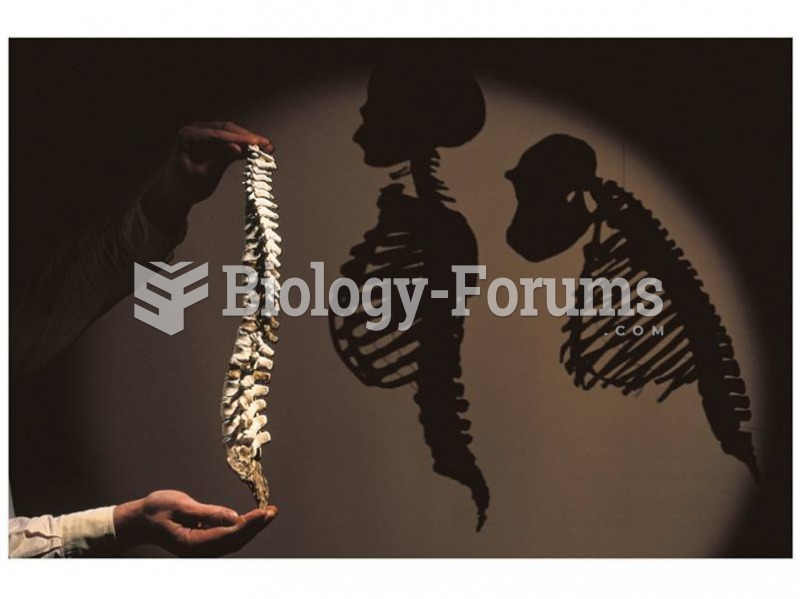 Reconstructed Australopithecus afarensis spine shows that species walked upright.
 Demonstrate the Application of Triangular, Figure-Eight, and Tubular Bandages
 Demonstrate the Application of Triangular, Figure-Eight, and Tubular Bandages
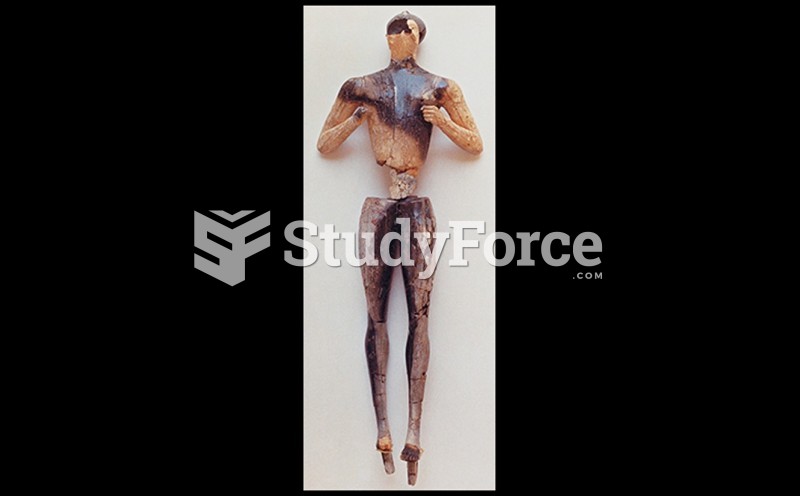 Statuette of a Male Figure
 Punnett square of the dihybrid cross shown in Figure 3.8. There are two combinations of dominant and