|
|
|

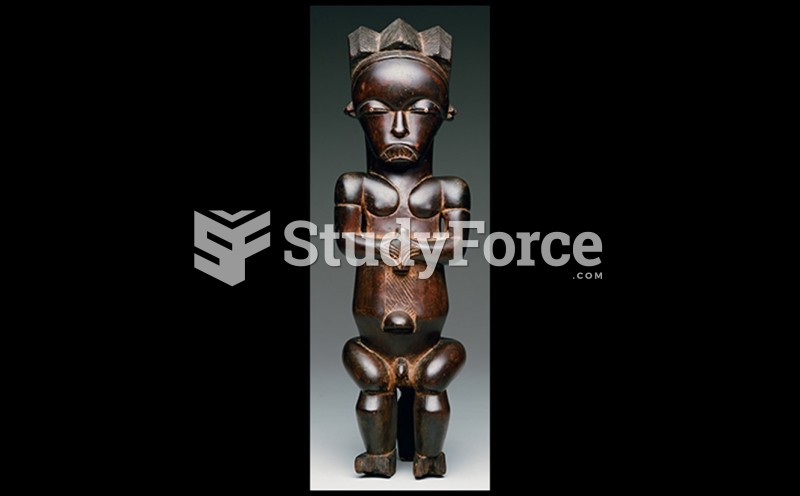 EYEMA-O-BYERI (Reliquary Figure)
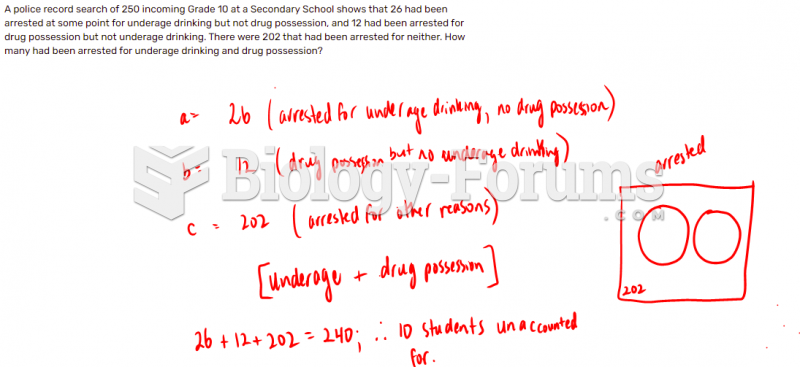 A police record search of 250 incoming Grade 10 at a Secondary School shows that 26 had been ...
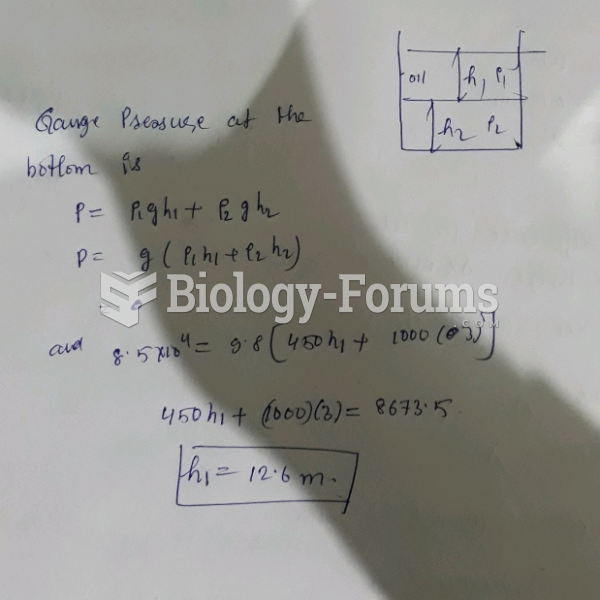 As shown in the figure, a large open tank contains a layer of oil ( density 450 kg/m3) floating ...
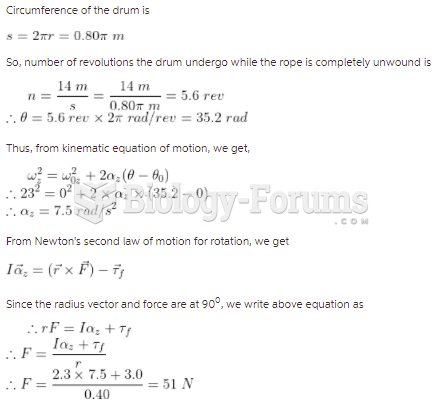 The drum shown in the figure has a radius of 0.40 m and a moment of inertia of 2.3 kg m2about ...
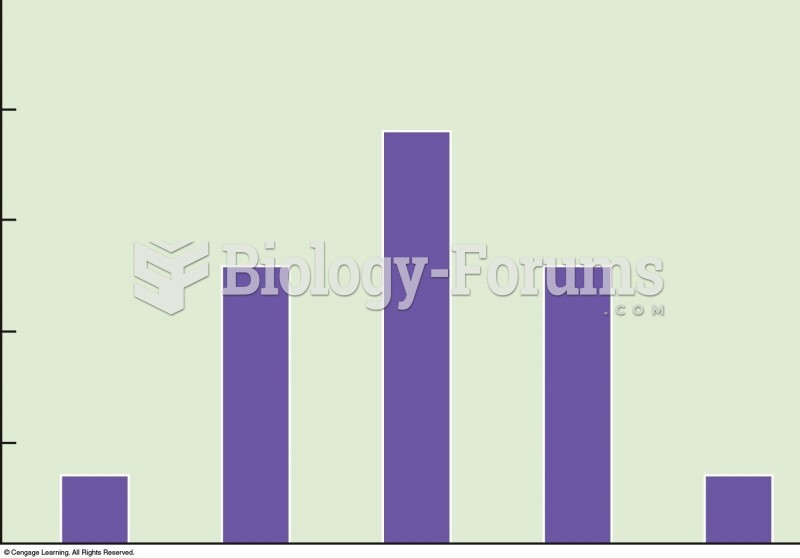 Frequency distribution of phenotypes from the possible offspring in Figure 5.7. Height of the offspr
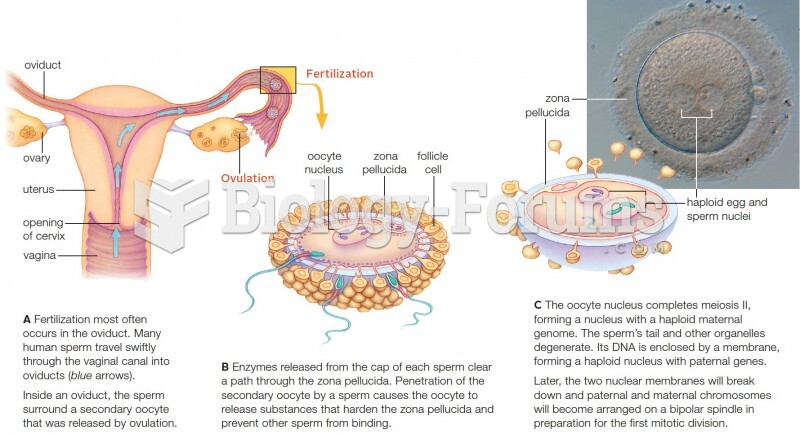 Events in human fertilization. The light micrograph shows a fertilized human oocyte.