This topic contains a solution. Click here to go to the answer
|
|
|

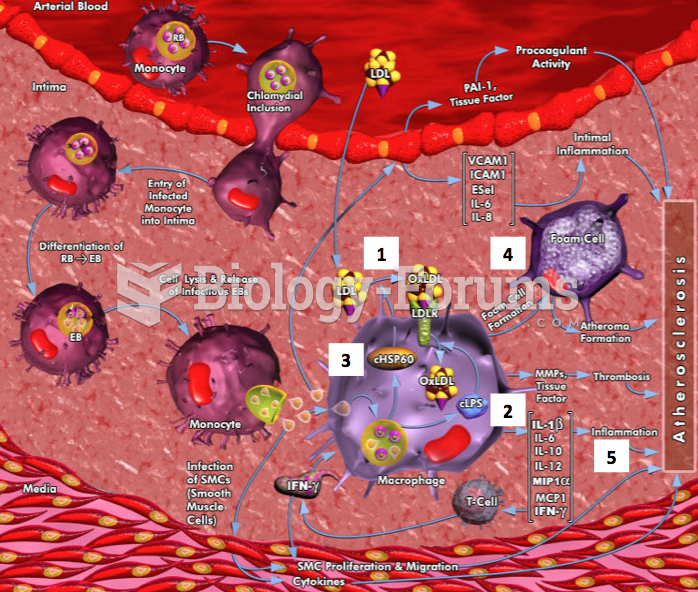 A schematic showing the progression of atherosclerosis
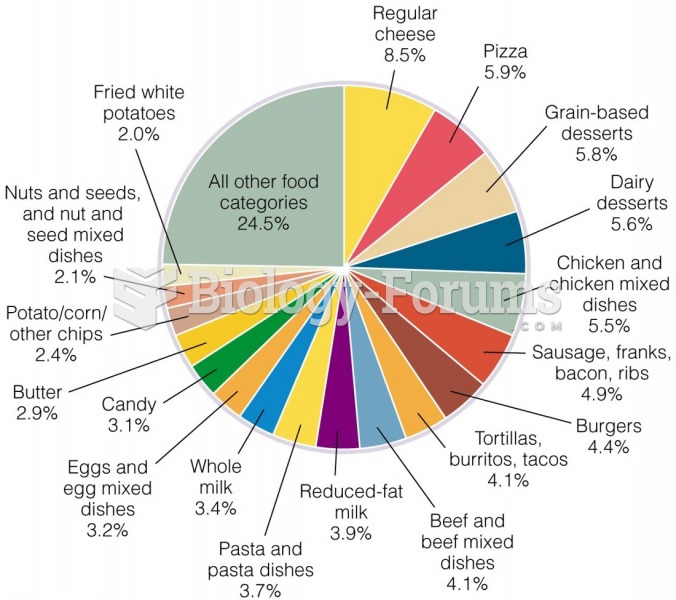 Major Food Sources of Saturated and Trans Fats for Americans
 Nearly all the food that you consume originates on a farm
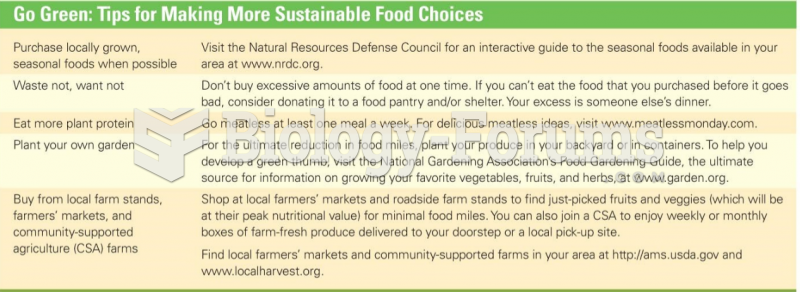 Go Green: Tips for Making More Sustainable Food Choices
 Total Fitness and Wellness, Brief Edition, 4th Edition
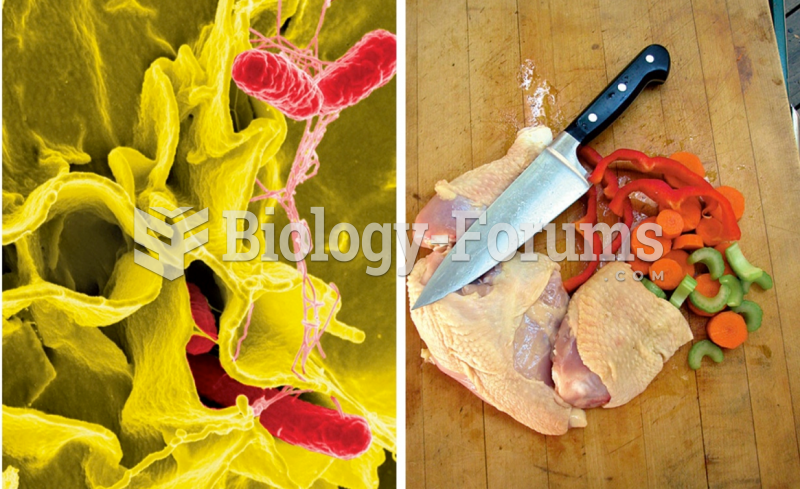 Food poisoning: Salmonella