This topic contains a solution. Click here to go to the answer
|
|
|

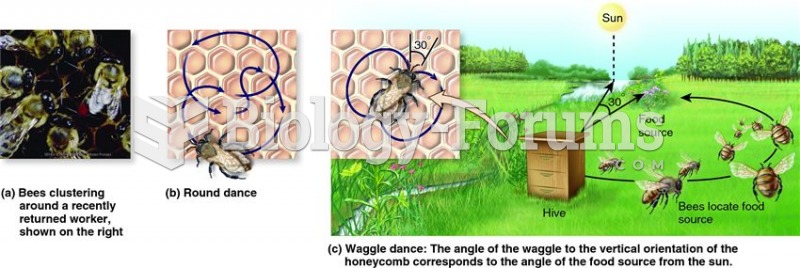 Tactile communication among honeybees regarding food sources.
 Aerial photo showing the placement of 24 study plots, each 50 m by 50 m, in the Chihuahuan Desert ne
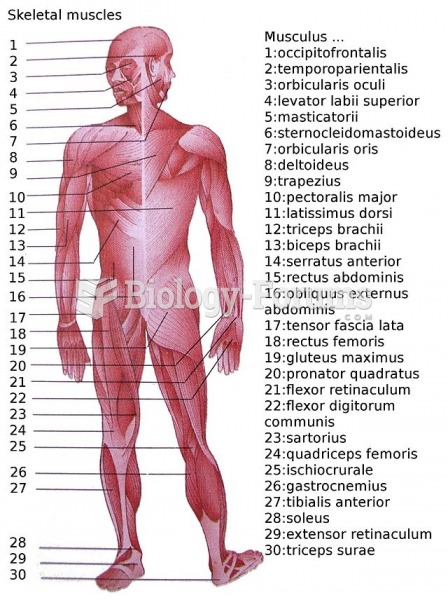 A schematic showing some of the skeletal muscles of a Homo sapiens.
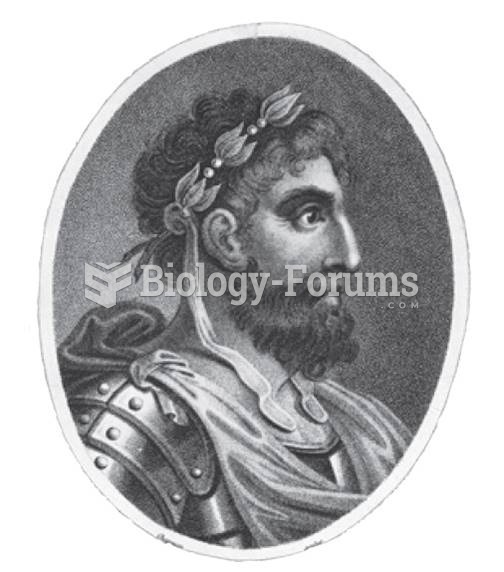 Xenophon (430–357 B.C.E.) Biographer of Socrates and his student as a youth. In addition to four ...
 A schematic showing that an inertia switch is connected in series between the fuel-pump relay and ...
 The total weight of Peter, David and Henry is 123 kg, Peter is 15 kg heavier than David. David ...