This topic contains a solution. Click here to go to the answer
|
|
|

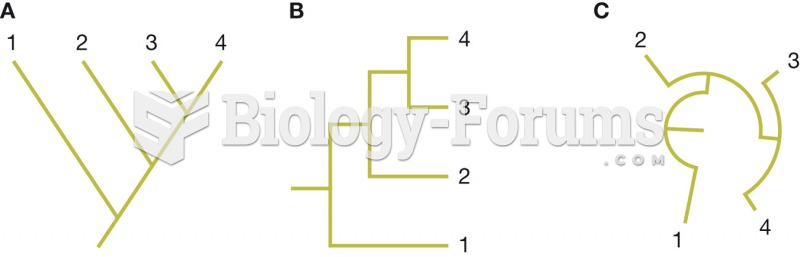 Different ways to depict phylogenetic relationships
 French and U.S. presidential elections in 2012 illustrate the durability of political culture and ho
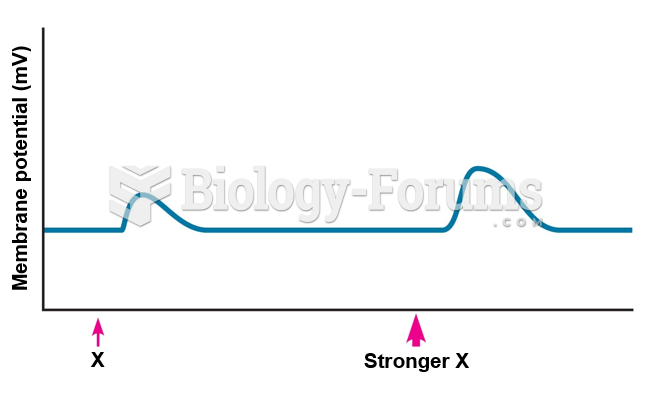 Effect of stimulus strength on size of graded potential.
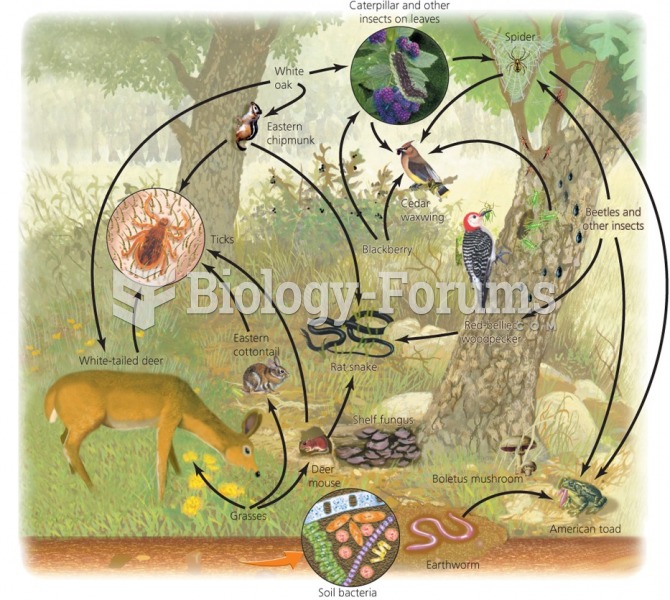 Food webs show feeding relationships and energy flow
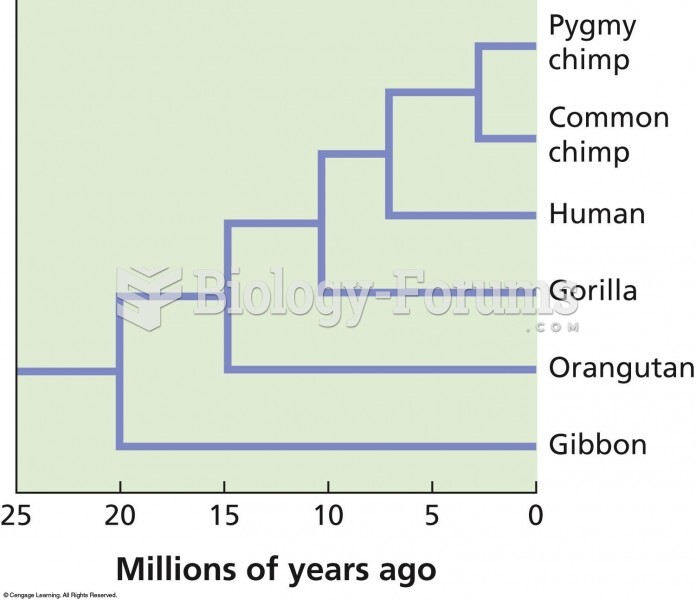 A phylogenetic tree showing the evolutionary relationships among hominoids. The evidence shows that
 Effect of nonsteroidal anti-inflammatory drugs (NSAIDs) on bicarbonate secretion by gastric cells