This topic contains a solution. Click here to go to the answer
|
|
|

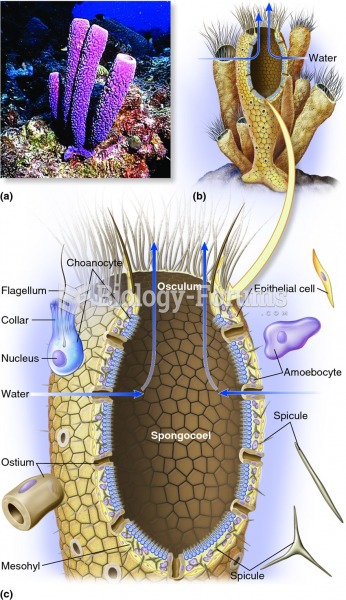 Relationships among major invertebrate lineages
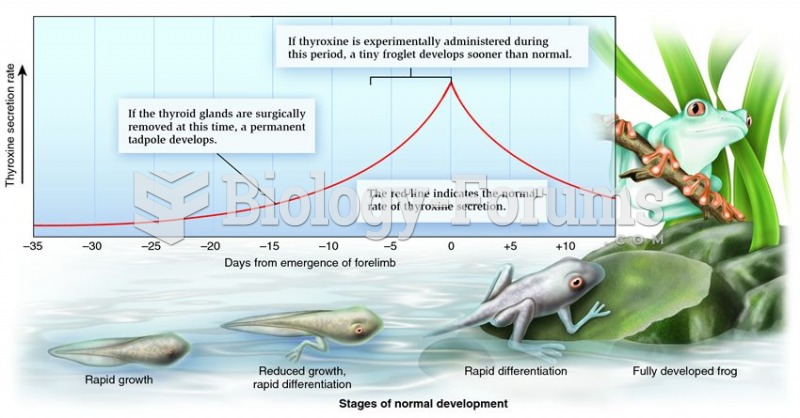 The effect of thyroid hormones on tadpole development
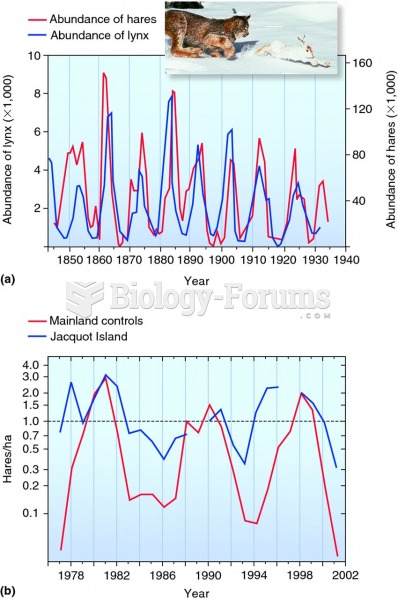 Effect of predator on prey populations.
 Medications That May Cause Myopathy as an Adverse Effect
 Effect of Winds on Horizontal Transport
 The effect of frameshift mutations on a DNA sequence repeating the triplet sequence GAG