This topic contains a solution. Click here to go to the answer
|
|
|

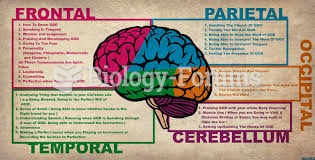 brain diagram
 Schematic diagram of RNA polymerase II with the CTD extended
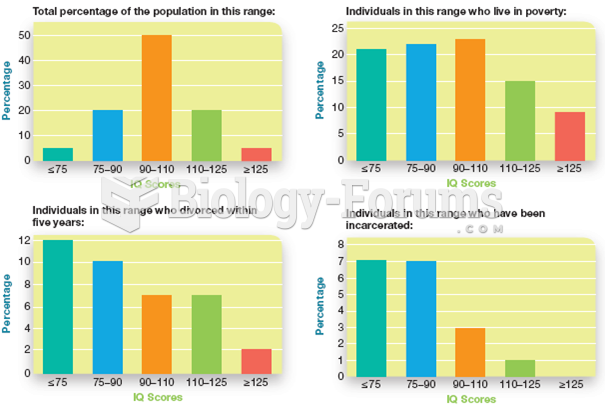 General Intelligence is Related to Various Outcomes
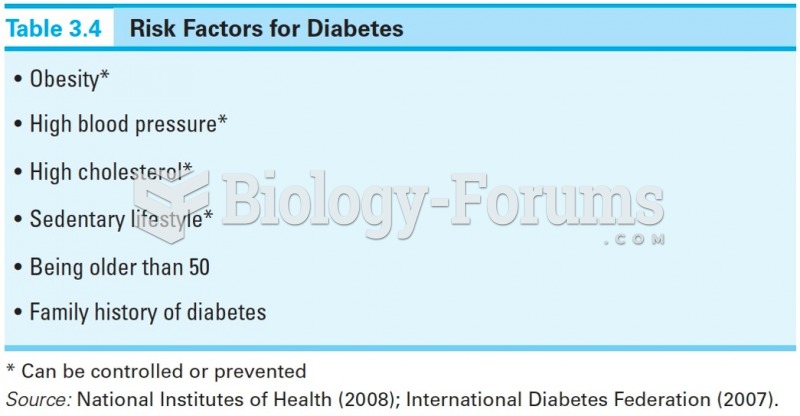 Risk Factors for Diabetes
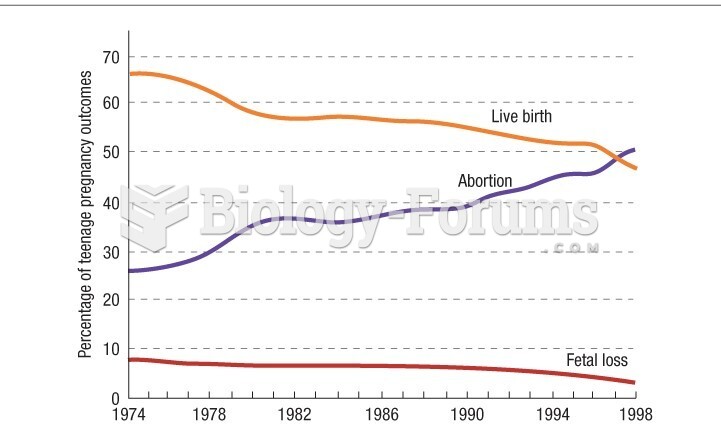 Percentage distribution of outcomes of teenaged pregnancy
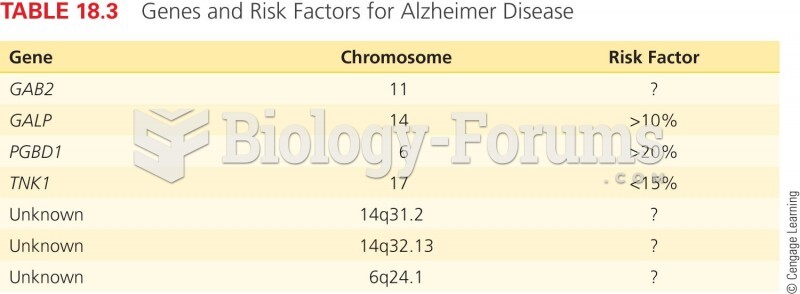 Genes and Risk Factors for Alzheimer Disease