This topic contains a solution. Click here to go to the answer
|
|
|

 Hubble’s Tuning Fork Diagram
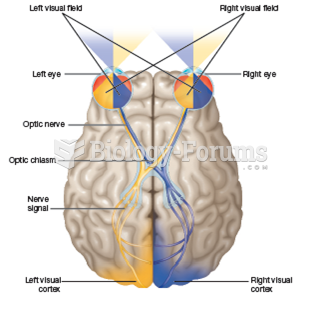 Pathways of the Visual System in the Brain
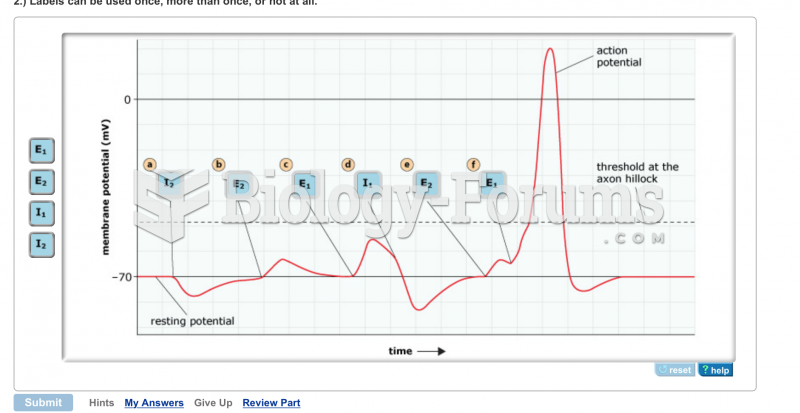 diagram of question asked
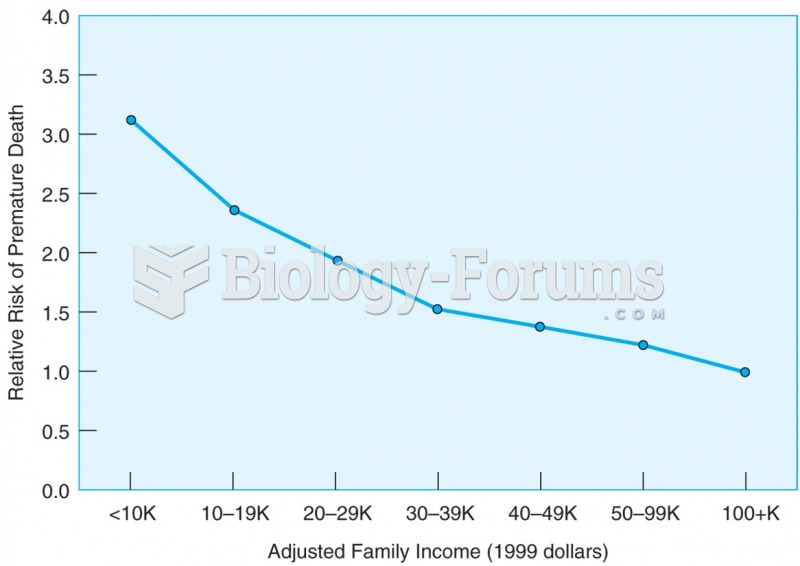 The risk of dying before the age of 65 gets lower as family income gets higher.
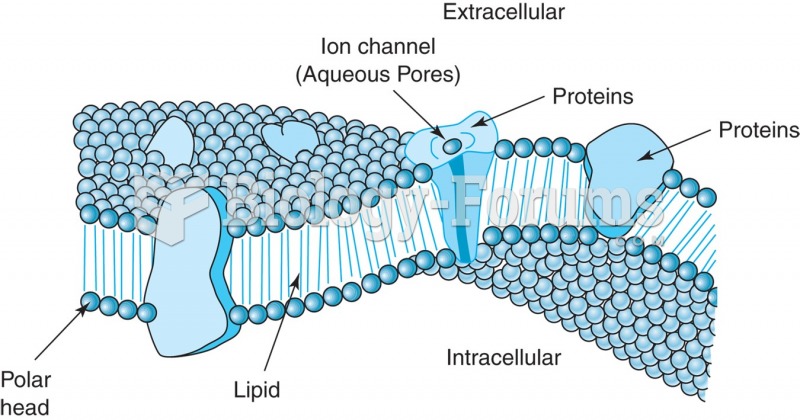 Diagram of a cell membrane. The cell membrane is a double layer of phospholipid molecules with ...
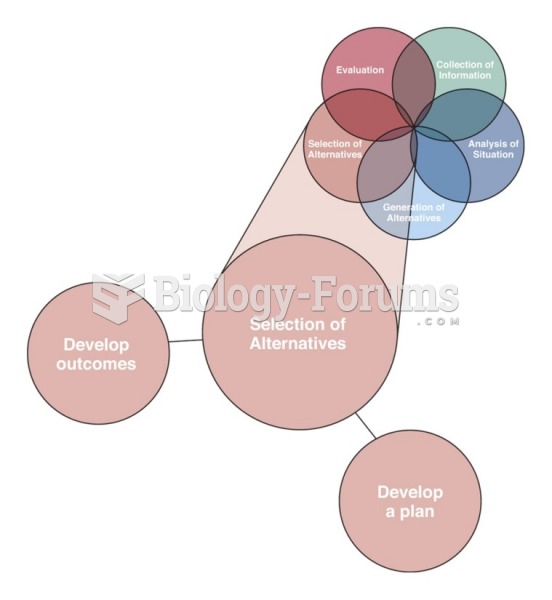 The two skills of the element Selection of Alternatives