This topic contains a solution. Click here to go to the answer
|
|
|

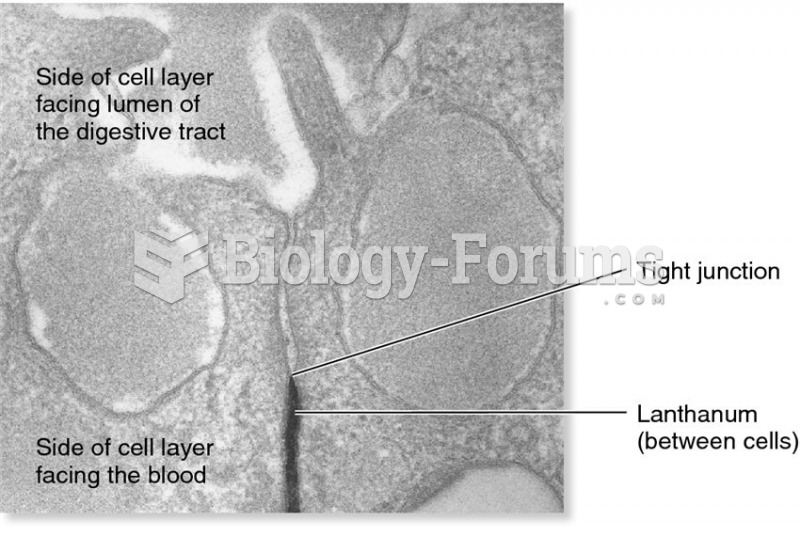 An electron micrograph from an experiment demonstrating the function of a tight junction
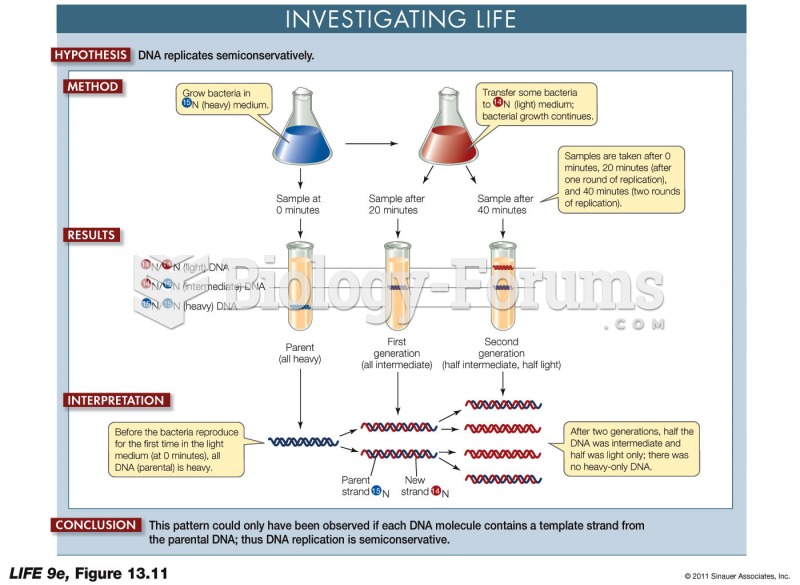 The Meselson-Stahl Experiment
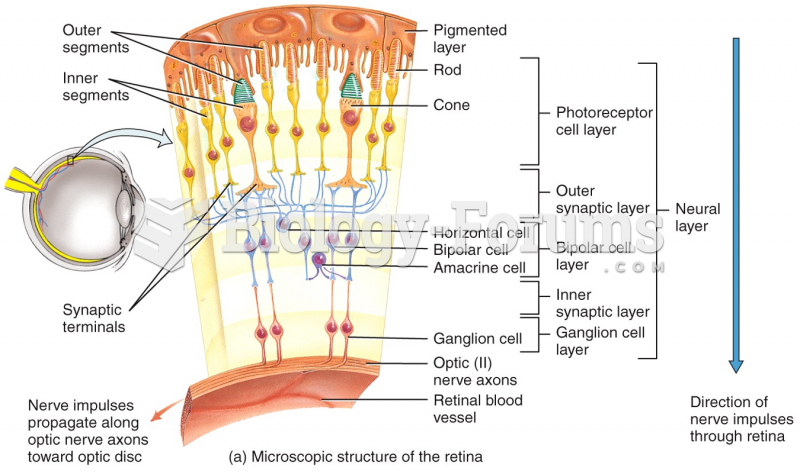 Microscopic structure of the retina
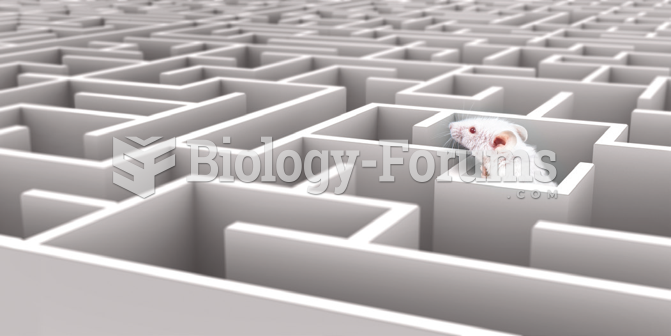 Rosenthal and Fode’s Rat Experiment
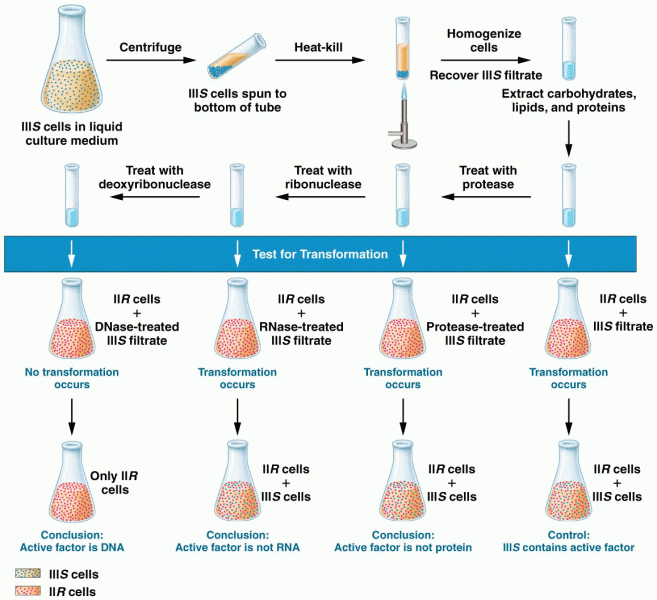 Summary of Avery, MacLeod, and McCarty’s experiment
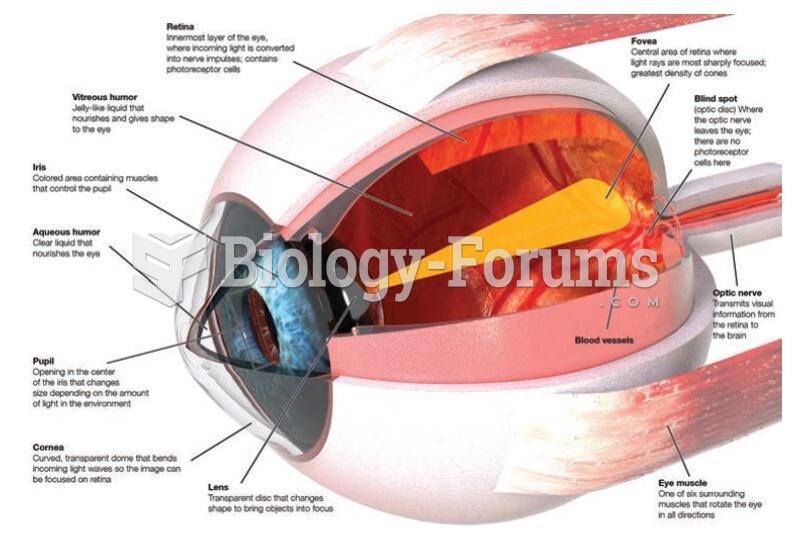 Structure of the Eye