This topic contains a solution. Click here to go to the answer
|
|
|

 Foamy Structure of the Universe
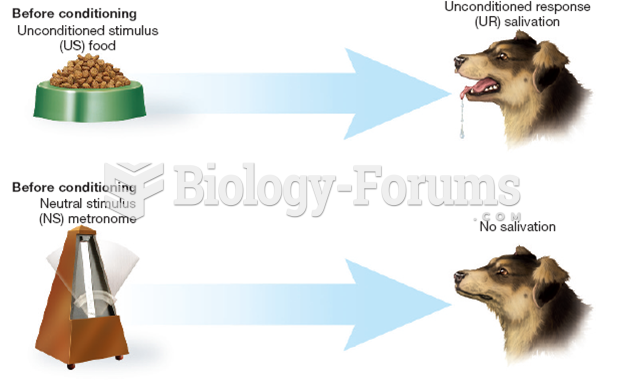 Pavlov’s Salivary Conditioning Experiment (1 of 2)
 Testing Distance Visual Acuity Using a Snellen Eye Chart
 High rates of rural poverty have been a part of the United States from its origin to the present. ...
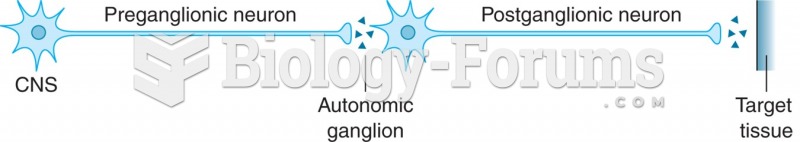 Basic structure of the autonomic nervous system.
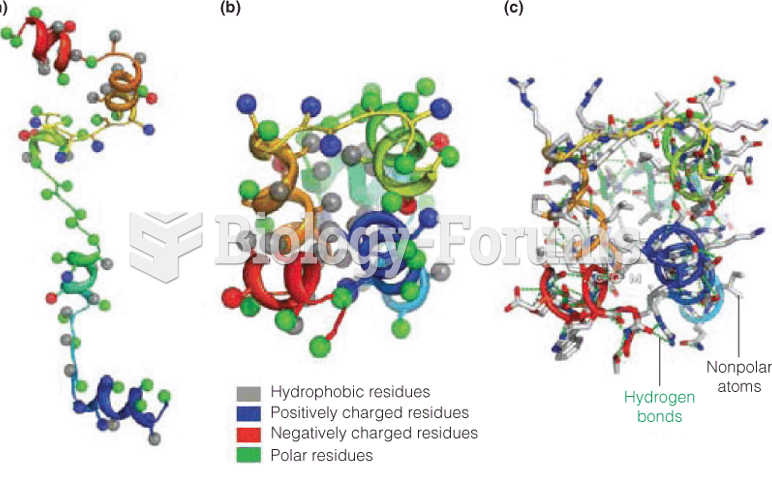 Schematic of de novo structure prediction using Rosetta