This topic contains a solution. Click here to go to the answer
|
|
|

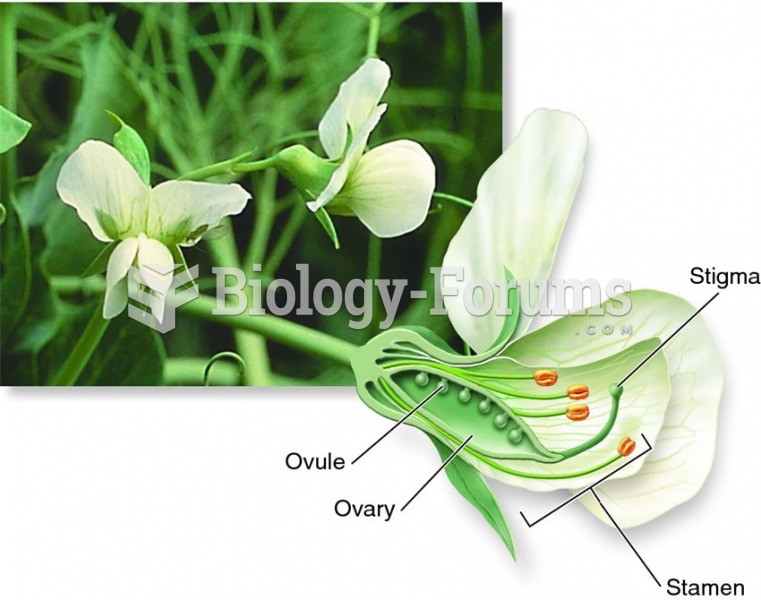 Flower structure in pea plants
 Structure of a Cell
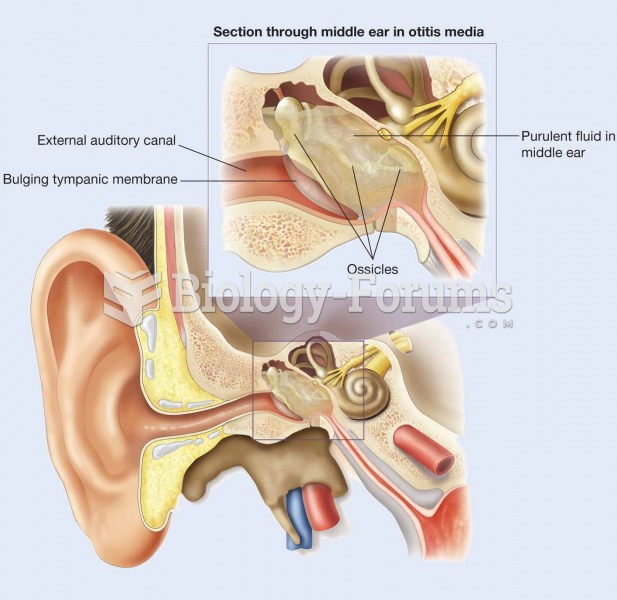 In acute otitis media, the tympanic membrane is usually bulging and purulent fluid is present in the
 Structure of the human immunodeficiency virus (HIV).
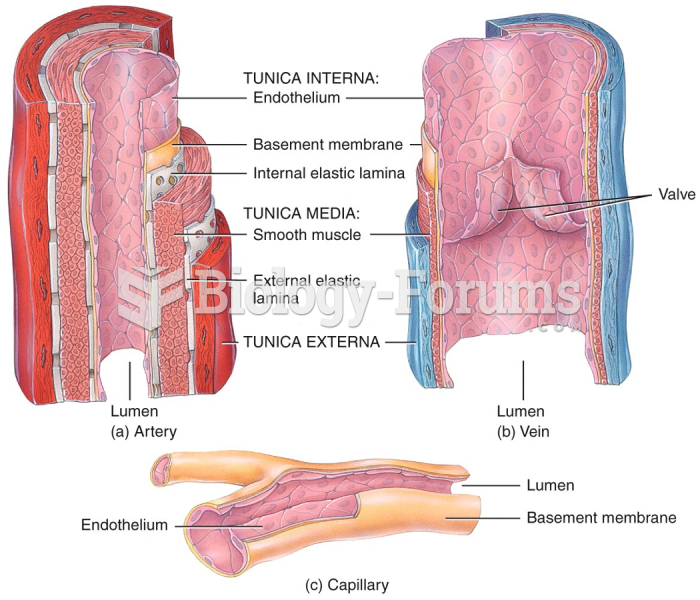 Comparing Blood Vessel Structure
 Structure of immunoglobulin molecules