This topic contains a solution. Click here to go to the answer
|
|
|

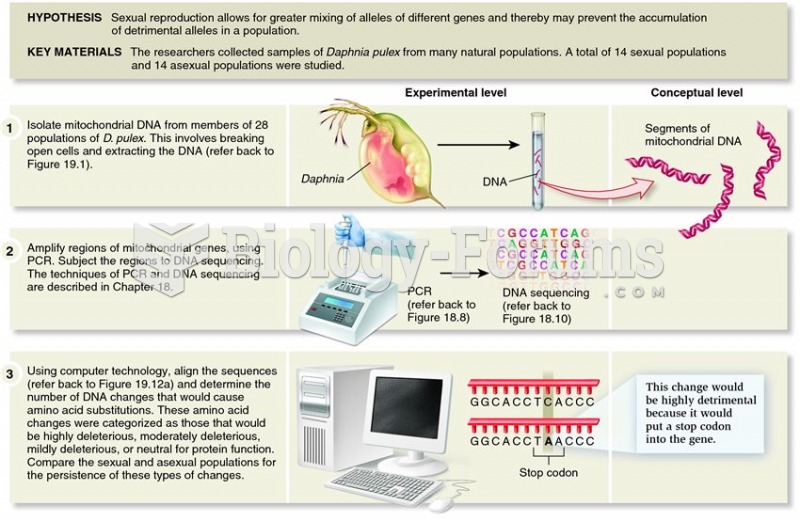 Paland and Lynch demonstrated the importance of sexual reproduction in reducing the frequency of mal
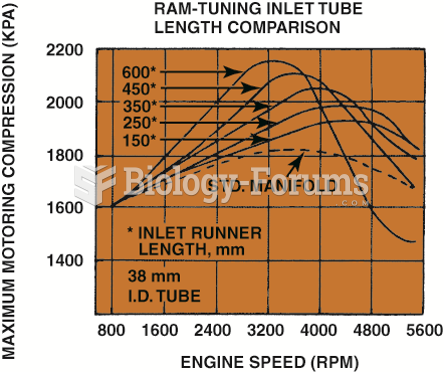 The graph shows the effect of sonic tuning of the intake manifold runners. The longer runners ...
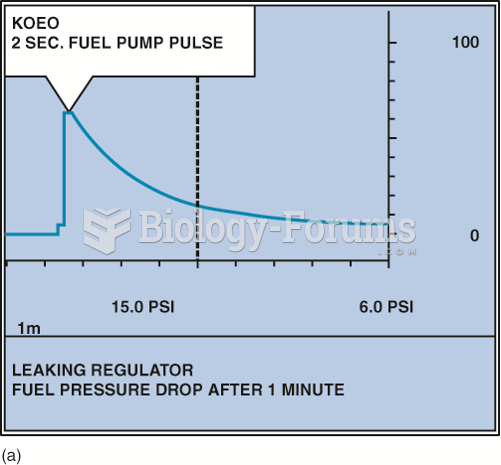 A fuel-pressure graph after key on, engine off (KOEO) on a TBI system.
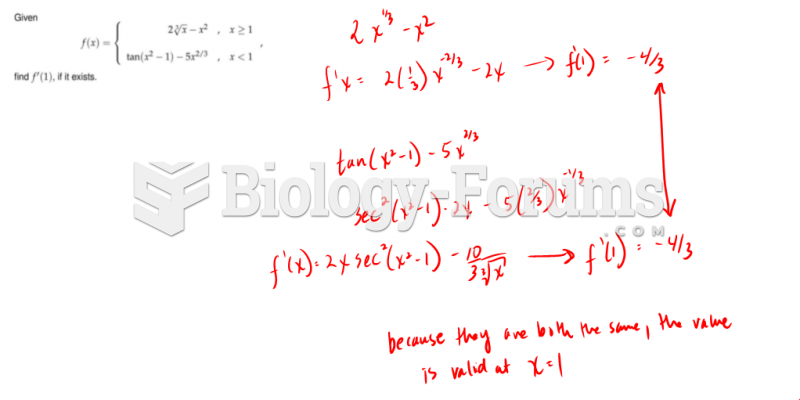 Piecewise Derivative Example (Continuous or not)
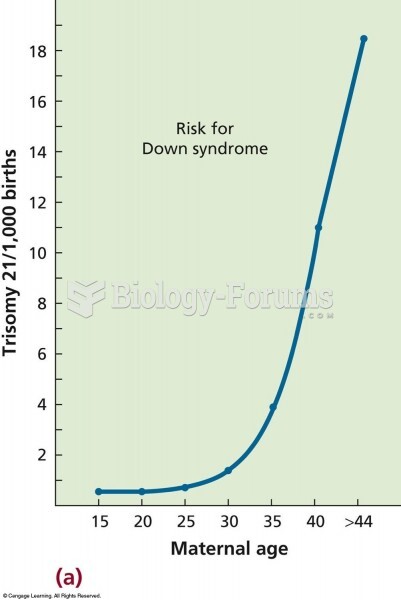 The relationship between maternal age and the frequency of trisomy 21 (Down syndrome). The risk incr
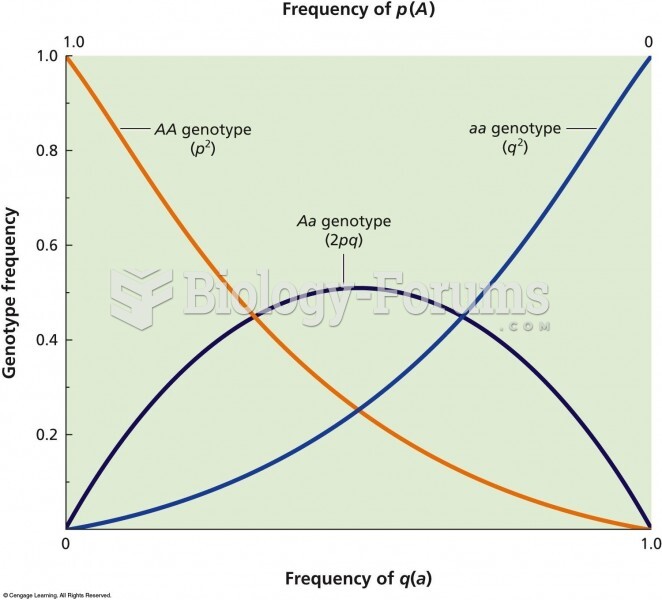 The relationship between allelic frequency and genotypic frequency in a population that is in Hardy-