|
|
|

![People have seen patterns in the stars since ancient times.[5] This 1690 depiction of the constellat](https://biology-forums.com/gallery/47/medium_12359_26_01_13_3_44_40.png) People have seen patterns in the stars since ancient times.[5] This 1690 depiction of the constellat
People have seen patterns in the stars since ancient times.[5] This 1690 depiction of the constellat
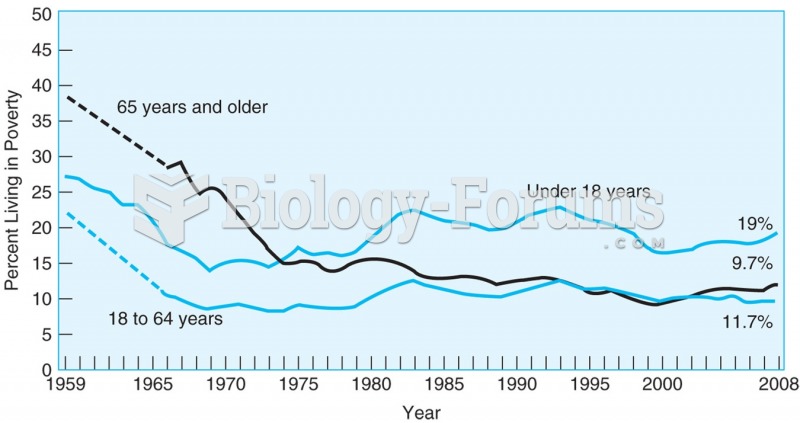 Poverty rates have declined in the last 50 years, and the biggest decline has been for people 65 and ...
 In old age, as in all other stages of the life course, people find life more pleasant if they have ...
 Do you see animals or people first?
 People are living longer today than in previous decades
 Contributions to political parties , by economic sector 2020