This topic contains a solution. Click here to go to the answer
|
|
|

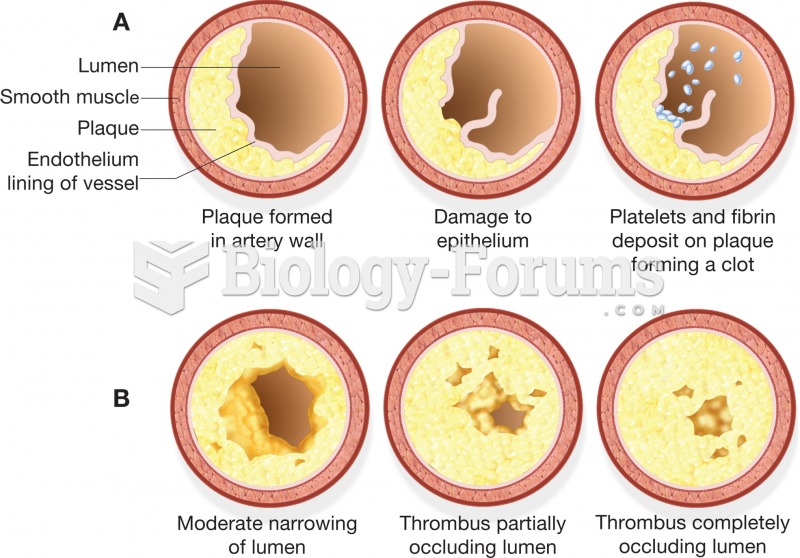 Development of an atherosclerotic plaque that progressively narrows the lumen of an artery to the po
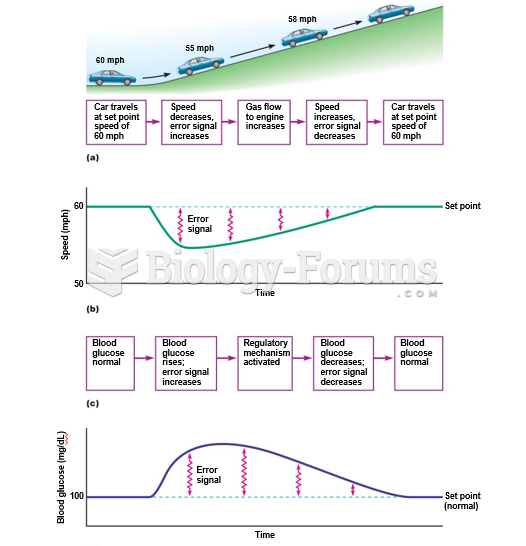 Negative feedback control of a regulated variable.
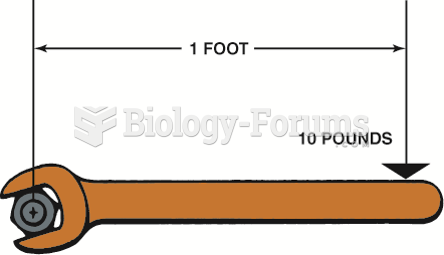 Torque is a twisting force equal to the distance from the pivot point times the force applied ...
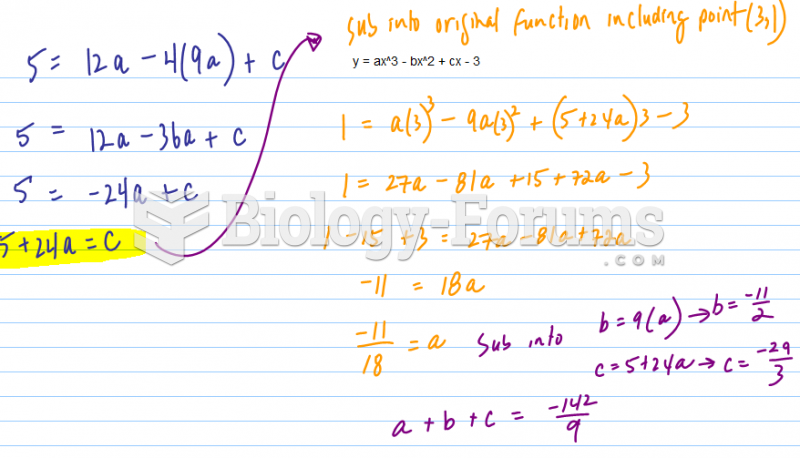 The slope of the curve y = ax^3 - bx^2 + cx - 3 at x = 2 is 5. If the point of inflection of the cur
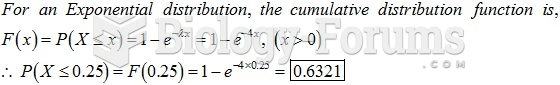 If the random variable x is exponentially distributed with parameter λ = 4, then P(x ≤ ...
 Linkage Data from 39 Families with Cystic Fibrosis