This topic contains a solution. Click here to go to the answer
|
|
|

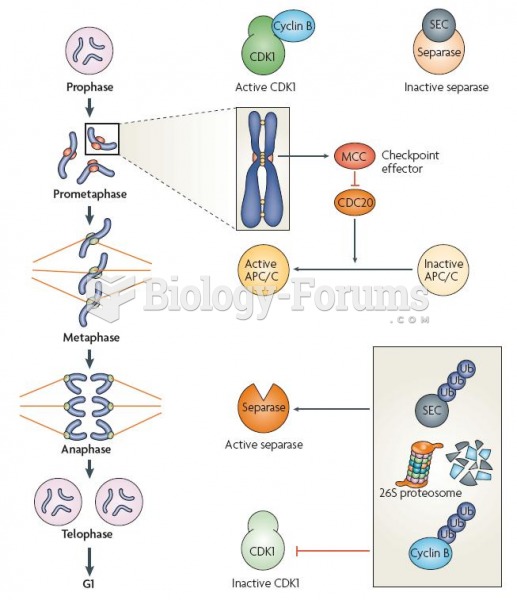 Relationship of the spindle-assembly checkpoint (SAC) with the cell-cycle machinery
 Seasonal changes in biomass and growth form of benthic algae in the Eel River, California: (a) in ea
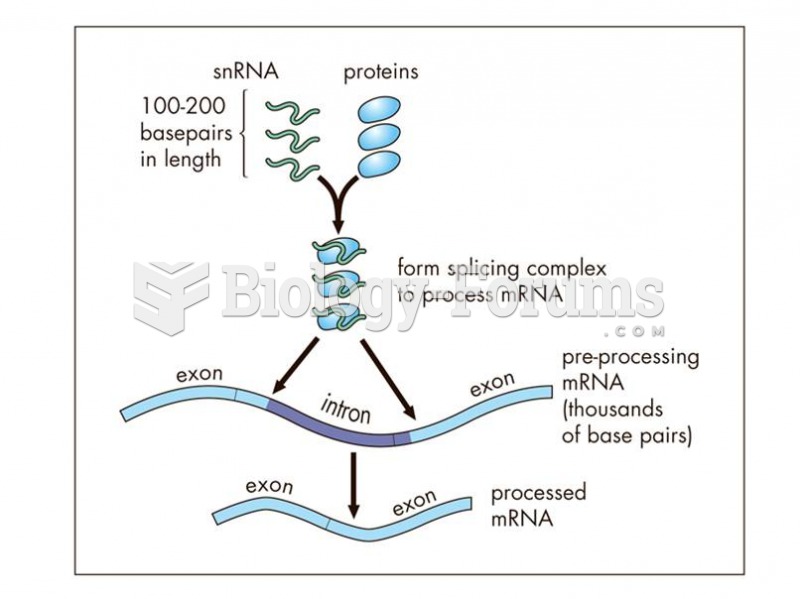 Small nuclear RNAs (snRNA), 100-200 bp in length, form part of the splicing mechanisms to process mR
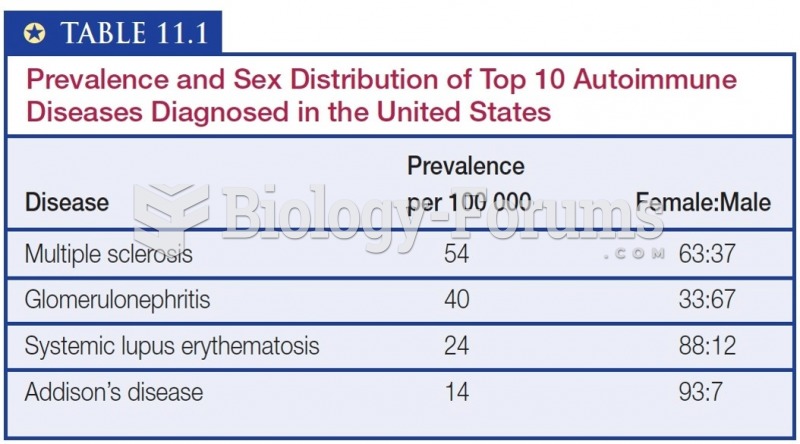 Prevalence and Sex Distribution of Top 10 Autoimmune Diseases Diagnosed in the United States
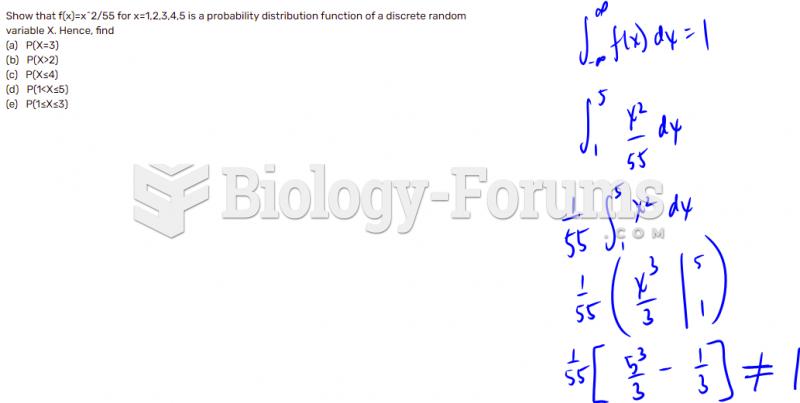 Discrete random variables- Probability Distribution Function
 General model of the association of histones and DNA to form nucleosomes