|
|
|

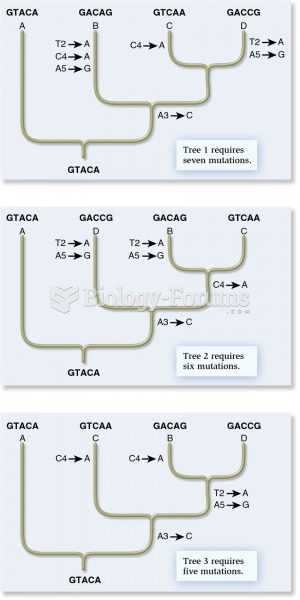 The cladistic approach from molecular genetic data
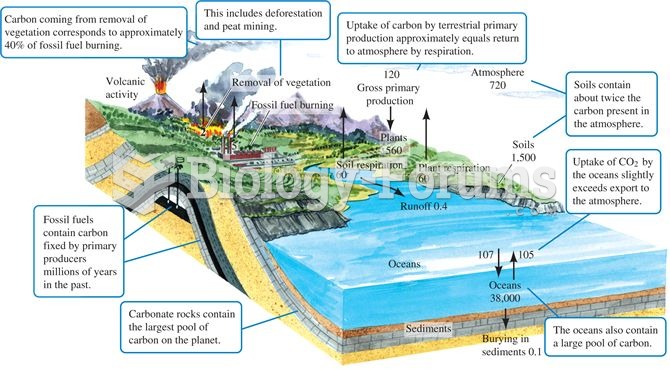 The carbon cycle. Numbers are storage as 1015 g or fluxes as 1015 g per year (data from Schlesinger
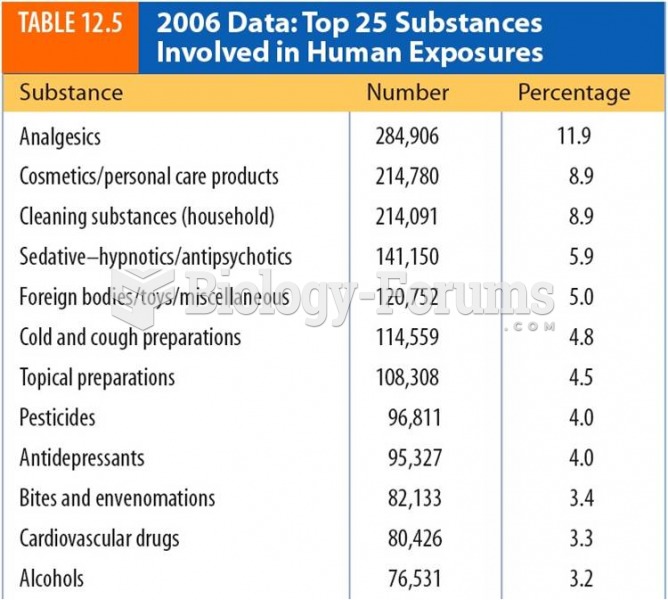 2006 Data:Top 25 Substances Involved in Human Exposures
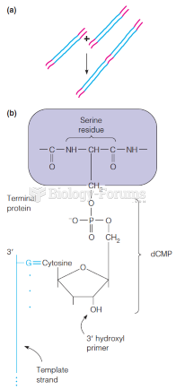 Strategies for replicating linear genomes
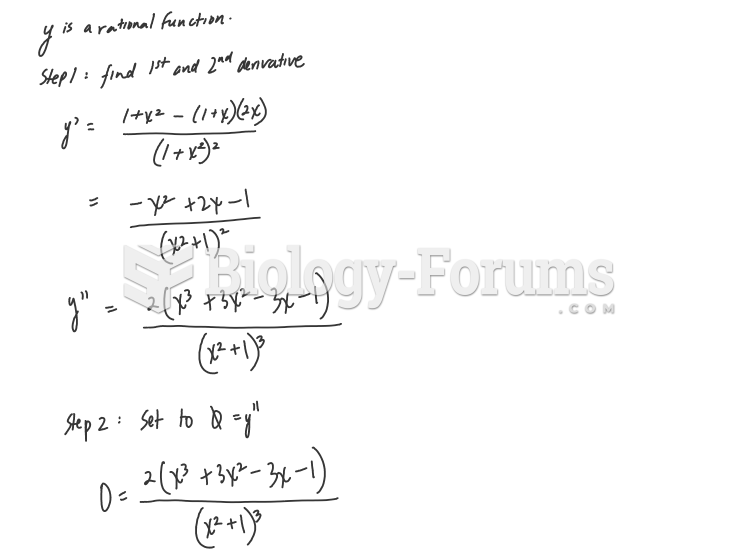 Calculus help: Show that y has three points of inflection and they all lie on...
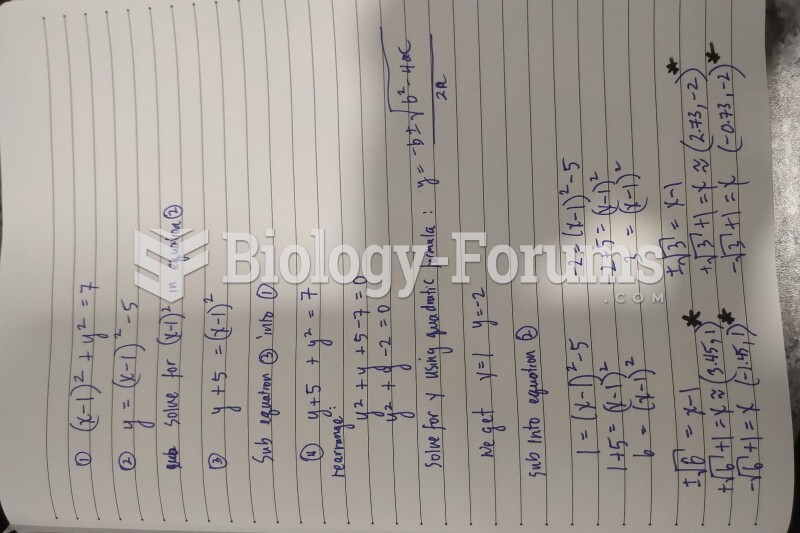 What if the equation for the parabola is a trinomial? How would you substitute the y-points ...