|
|
|

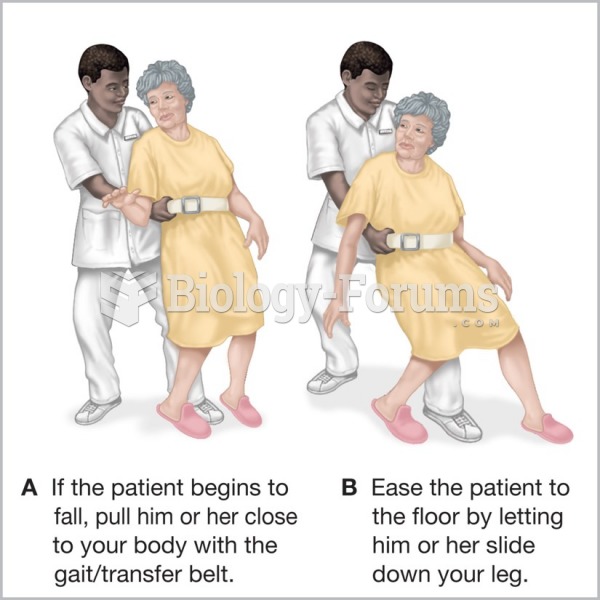 Assisting a falling patient.
 The upper panel shows that scores of four diverse samples of boys on a moral reasoning test show a ...
 The Gender Pay Gap Over Time: What Percentage of Men's Income Do Women Earn?
 What Percentage of U.S. Married Women Ages 40-44 Have Never Given Birth?
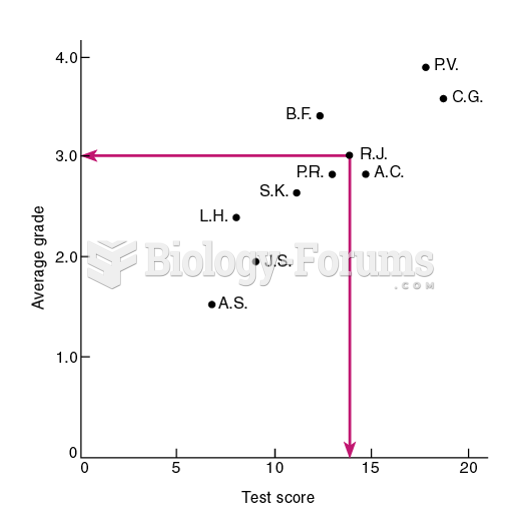 A Scatterplot of the Test Scores and Average Grades of 10 Students
 Percentage of Full Tryptophan Expression for trpR+ and trpR- Strains