|
|
|

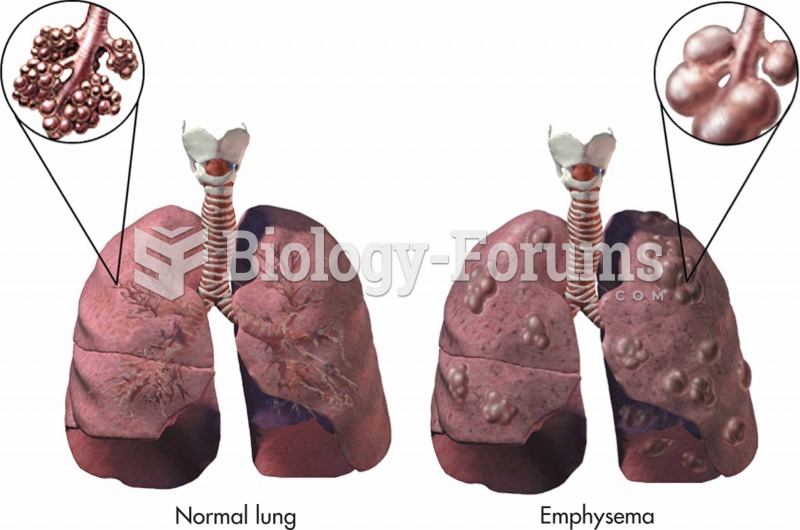 Normal lung and one with emphysema.
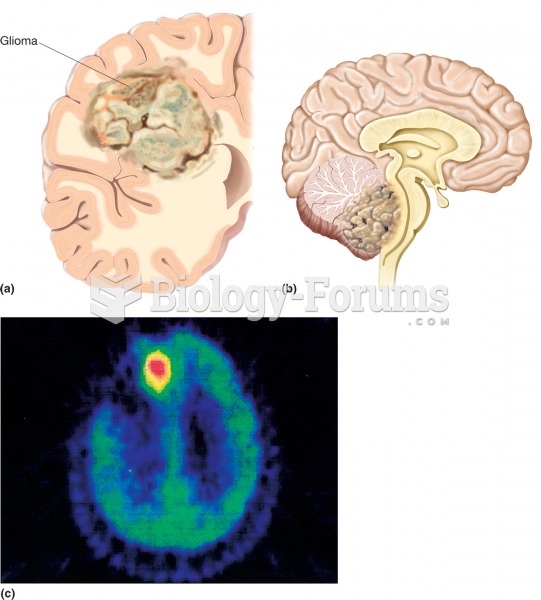 Glioma. (a) Illustration of a large glioma (colored area) within the left cerebral hemisphere in a s
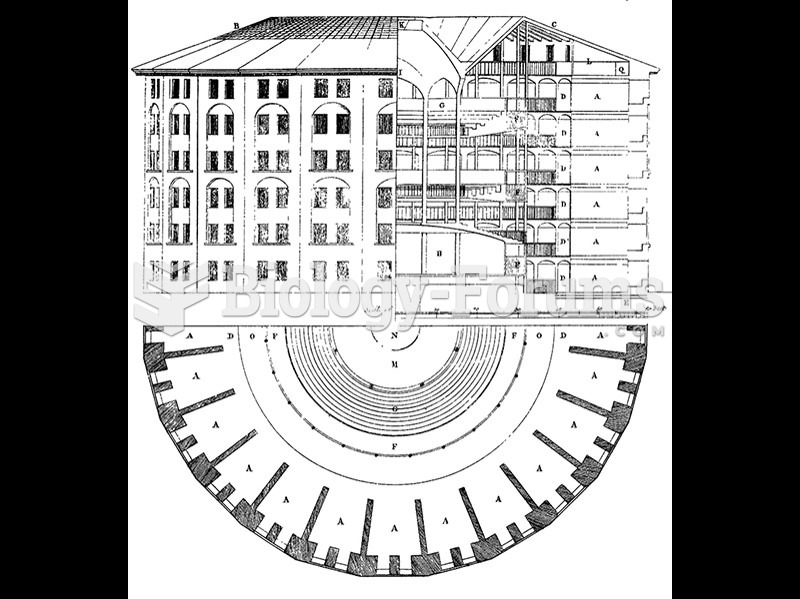 Jeremy Bentham, A General Idea of a Penitentiary Panopticon, drawn by Willey Reveley.
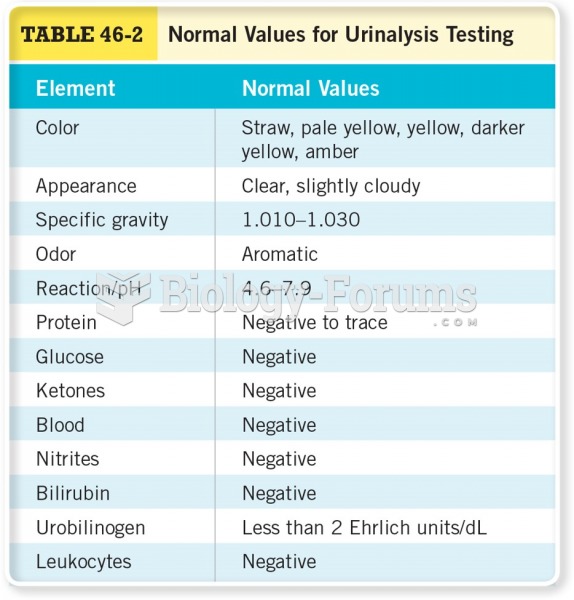 Normal Values for Urinalysis Testing
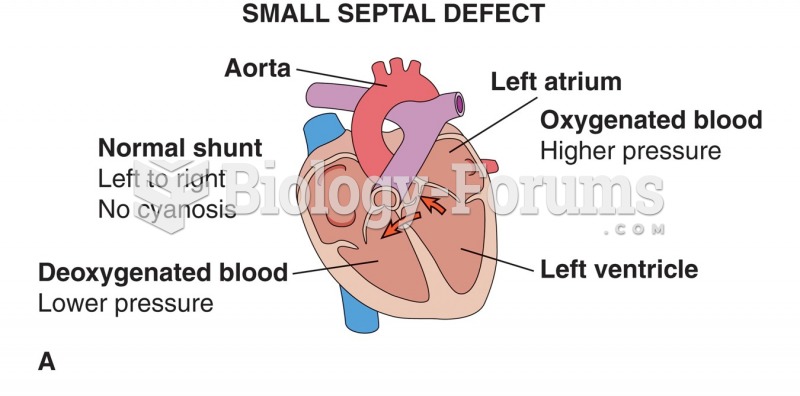 Effects of septal defects: (A) normal shunt; no cyanosis; (B) increased pressure in right ventricle; ...
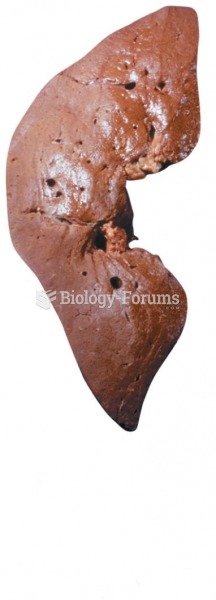 Normal Liver