|
|
|

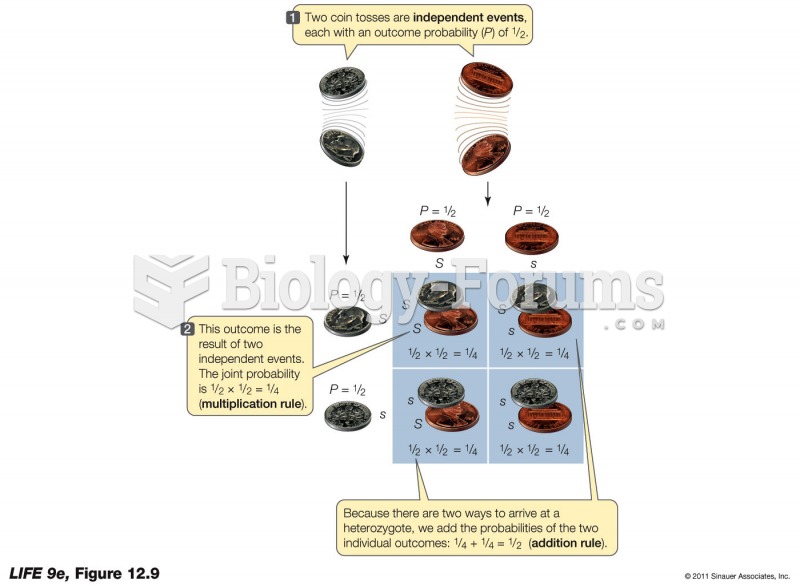 Using Probability Calculations in Genetics
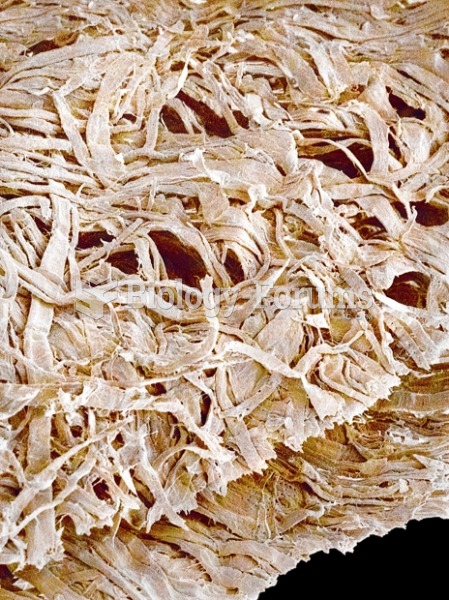 Toilet Paper
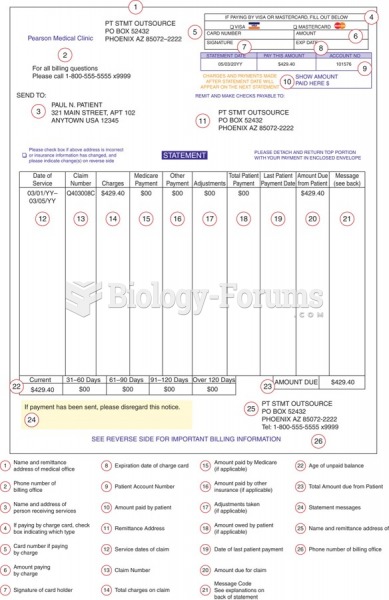 Example of a patient statement.
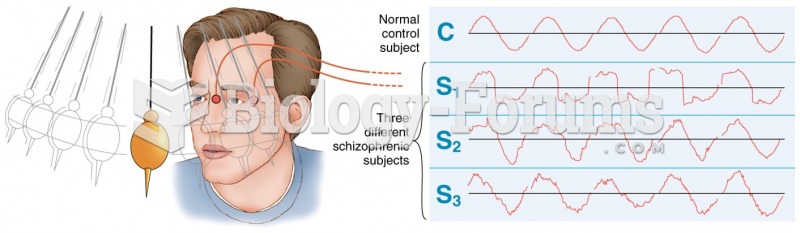 Visual tracking of a pendulum by a normal control subject (top) and three schizophrenics. (Adapted ...
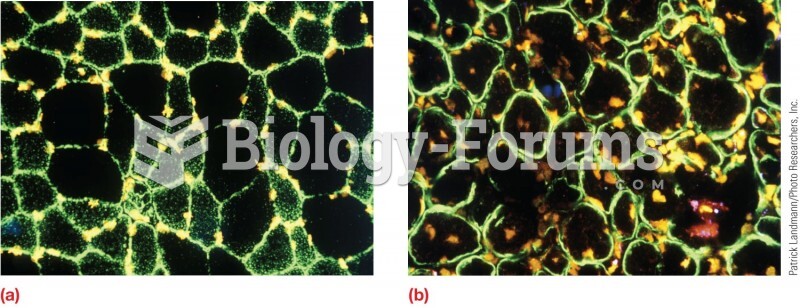 Distribution of dystrophin in muscle cells. (a) In normal muscle cells, all the dystrophin is locate
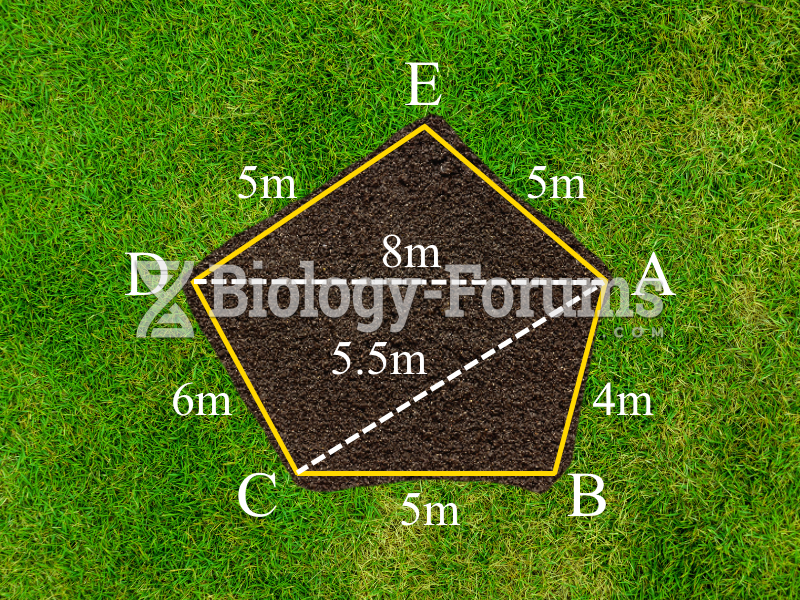 Plot of land (Part c)