If sample data are taken from a population that is normally distributed, a normal probability plot of the observed data values versus the expected z scores will
A) be approximately linear. B) have no discernable pattern.
C) look exponential in nature. D) have a correlation coefficient near 0.
Question 2
A normal probability plot is a graph that plots _____________ versus _____________.
A) observed data, normal scores B) normal score, observed data
C) normal data, observed scores D) observed scores, normal data

 Normal ECG tracing.
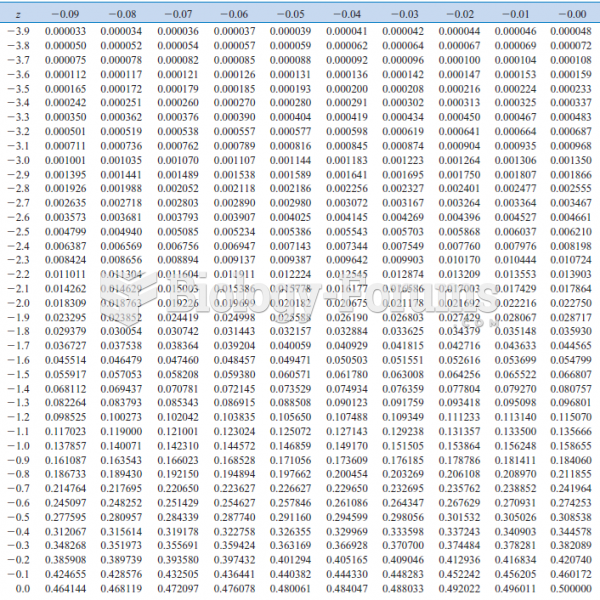 Cumulative Standard Normal Distribution
 Three types of “end feel” in normal joints.
 The material safety data sheet (MSDS) for sulfuric acid showing the detailed technical information ...
 Population Ecology "البيئة السكان"
 Normal conduction pathway in the heart