This topic contains a solution. Click here to go to the answer
|
|
|

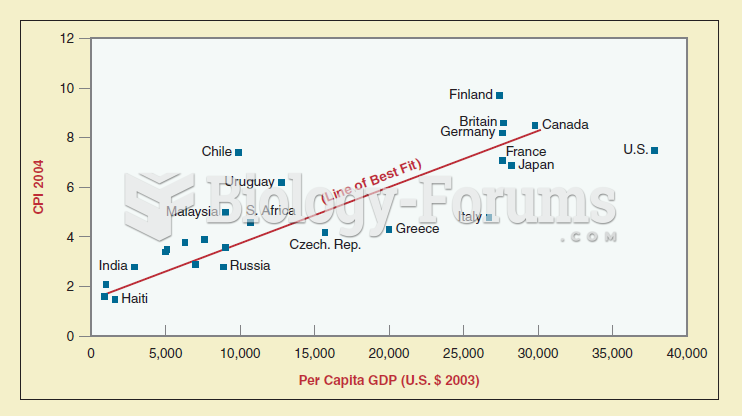 Scattergrams are a mechanism used by political scientists to show patterns and relationships among v
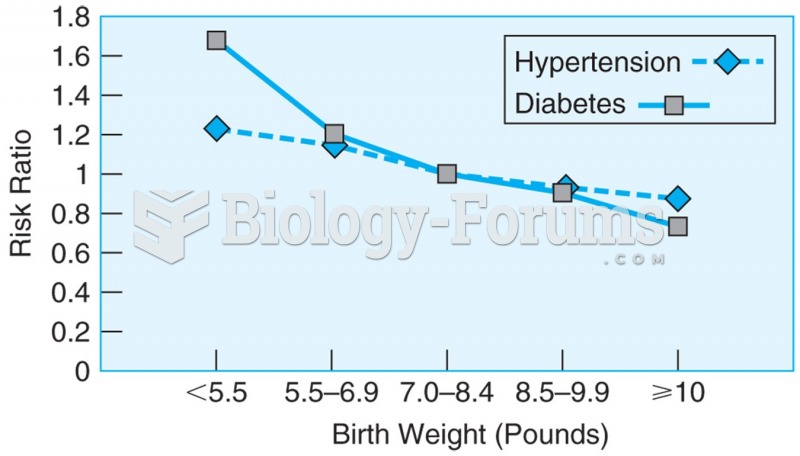 Data from more than 22,000 men over the age of 40, showing the relationship between birth weight and ...
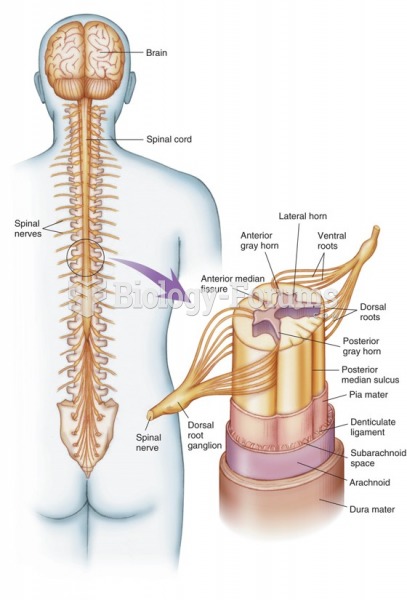 The brain, spinal cord, and spinal nerves. An expanded view of the spinal cord is shown.
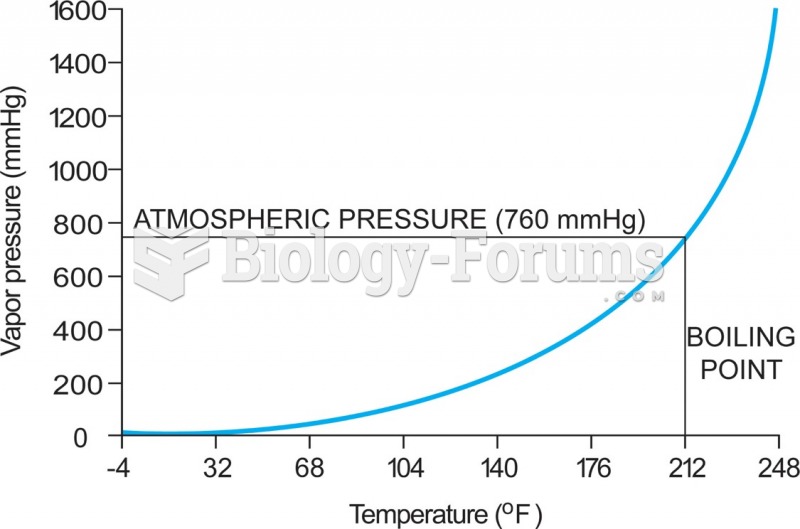 5-4 The relationship between vapor pressure and temperature—in this case for water. As the ...
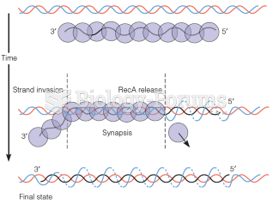 The RecA strand exchange reaction as shown from single-molecule studies
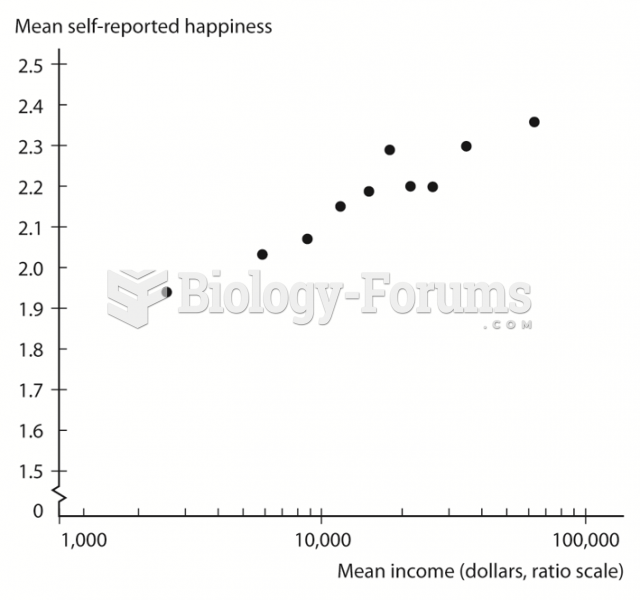 Relationship between Income and Happiness in the United States