This topic contains a solution. Click here to go to the answer
|
|
|

 These two species of bedstraw grow predominately on different soil types: Galium saxatile (shown her
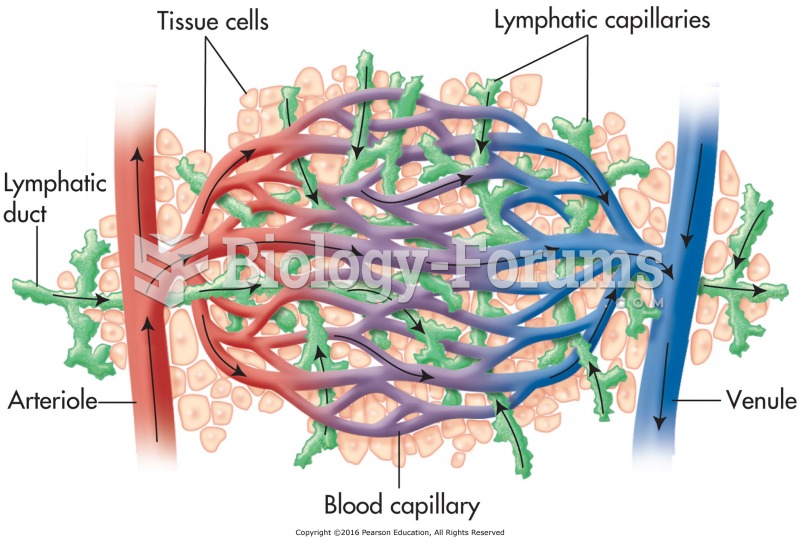 Relationship of the lymphatic system to the cardiovascular system.
 The relationship between the height of the firing line and length of the spark line can be ...
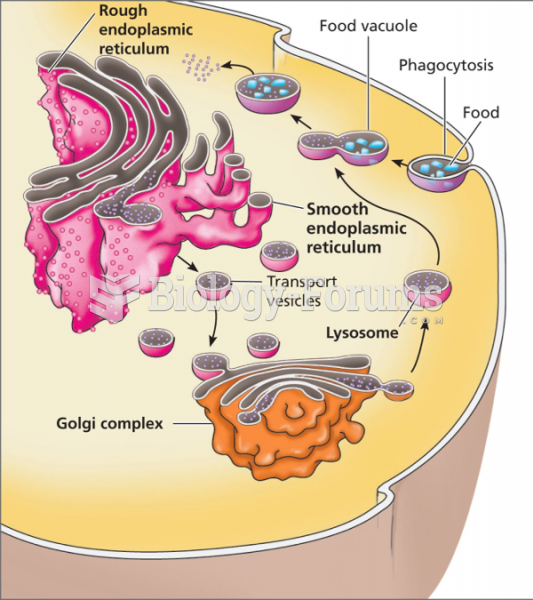 The relationship between the Golgi complex and lysosomes
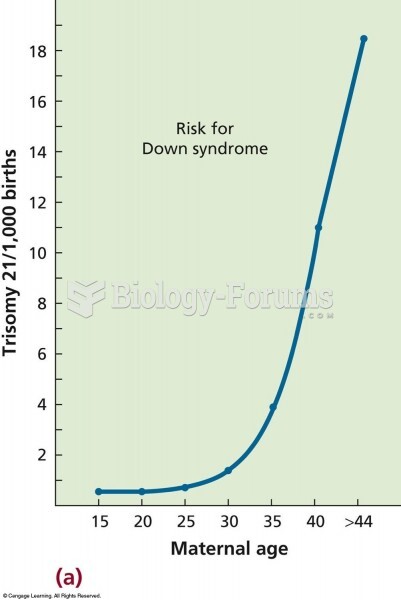 The relationship between maternal age and the frequency of trisomy 21 (Down syndrome). The risk incr
 The colinear relationship