This topic contains a solution. Click here to go to the answer
|
|
|

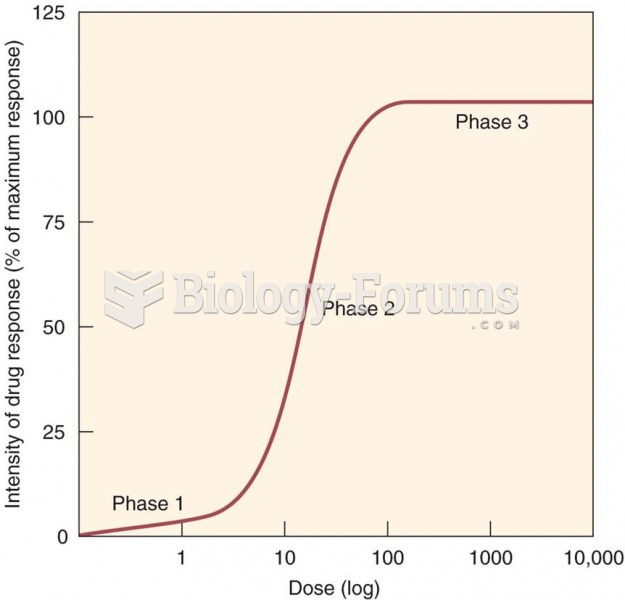 Dose–response relationship
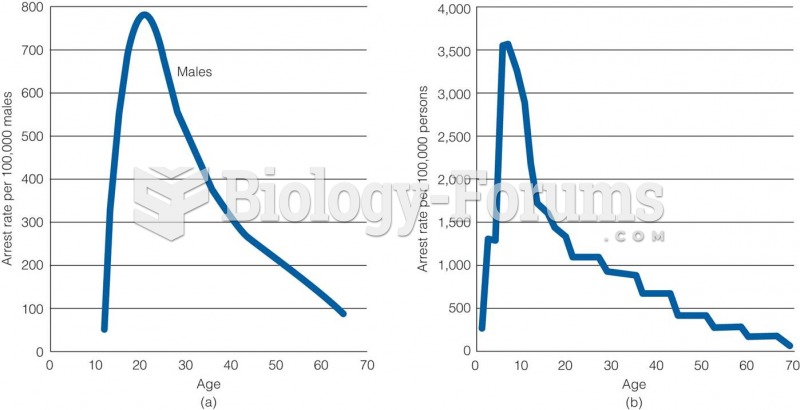 Age-Crime Relationship in (a) 1842 and (b) 1992
 One of the reasons I went to Cambodia was to interview a feral child—the boy shown here—who ...
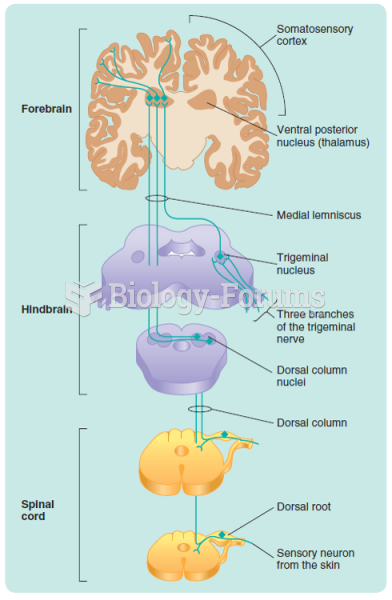 The dorsal-column medial-lemniscus system. The pathways from only one side of the body are shown.
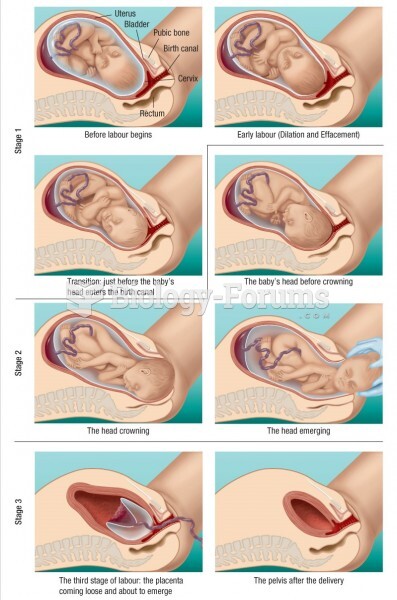 The sequence of steps during delivery is shown clearly in these drawings
 Relationship between birth weight and mortality in humans