What does the above graph ( insert Fig. 4.1 ) represent?
A) Choice is a function of incentives to participant
B) Incentives are a function of choice to engage in attitude change
C) Higher freedom to choose means you need more money to change your attitudes
D) Mean attitude change as a function of choice and incentive conditions
Question 2
Thelma is conducting a study on the political attitudes of college students. In an attempt to form equivalent experimental groups, Thelma randomly assigns the students to one of three different conditions, based on the students' grade point averages.
In this example, GPA represents the
a. independent variable.
b. dependent variable.
c. matching variable.
d. confounding variable.

 An example of modification of a structure for a new function
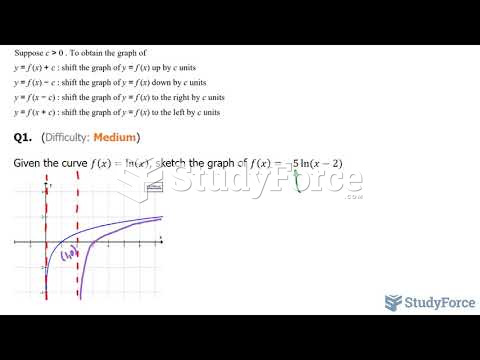 How to transform the natural logarithmic function (lnx)
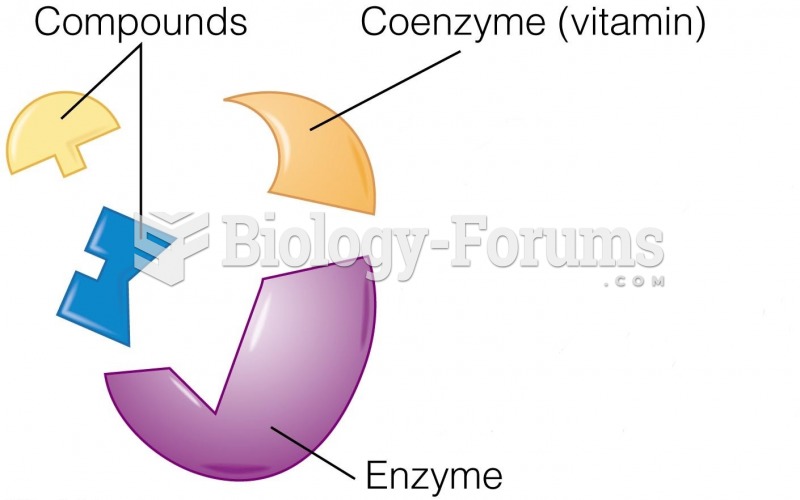 How B Vitamins Function as Coenzymes
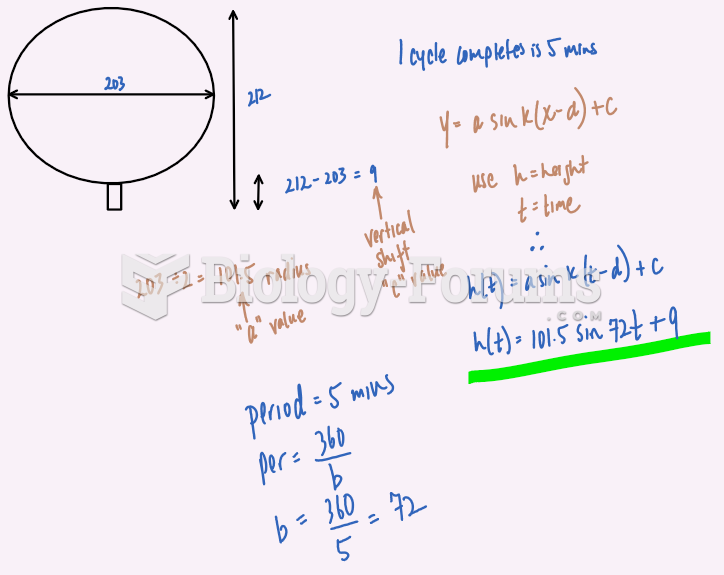 Ferris Wheel Periodic Function
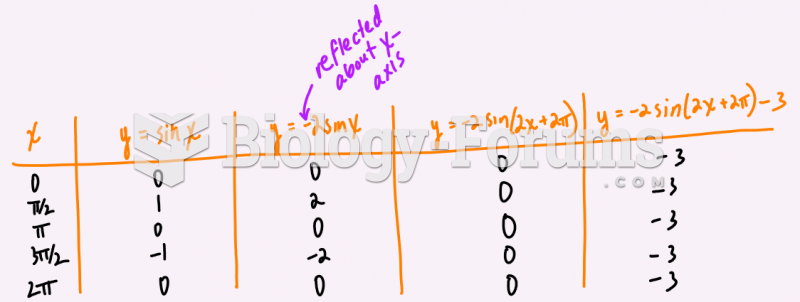 State the transformations on the function f(x)= 4sin(x-pi)-2 and then graph two cycles below.
 State the transformations on the function f(x)= 4sin(x-pi)-2 and then graph two cycles below.